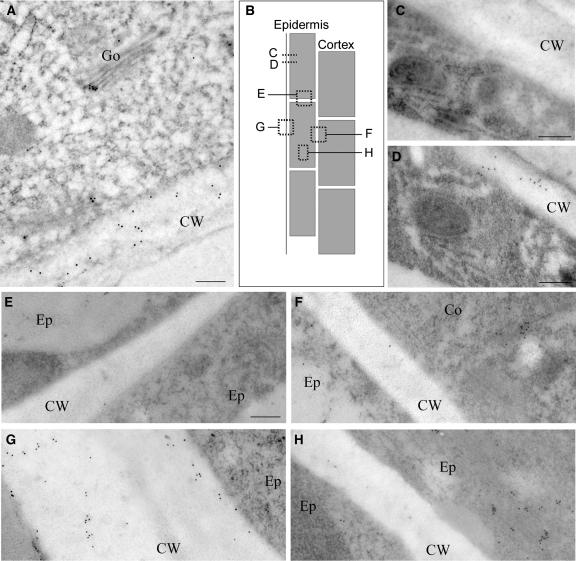
Figure 8.
COB Subcellular Distribution in the Root Elongation Zone Revealed by 10-nm Immunogold Labeling of Sectioned High-Pressure-Frozen Material.
(A) Tangential section from the outer epidermis shows COB associated with the Golgi and in the cell wall.
(B) Scheme of the root in longitudinal view depicts the section planes from which the images in (C) to (H) were obtained.
(C) and (D) Transverse sections from the same series of the outer epidermis ∼350 nm apart. Note the absence of COB from section (C) but its relative abundance in the cytoplasm and cell wall of (D), consistent with the banding pattern observed by immunofluorescence.
(E) Transverse anticlinal section between adjacent epidermal cells shows low abundance of COB.
(F) Longitudinal periclinal section between the epidermis and the cortex shows COB in the cytoplasm but relatively little in the cell wall.
(G) Outer epidermal periclinal section shows abundant COB in both the cytoplasm and the cell wall.
(H) Longitudinal-radial section between adjacent epidermal cell files shows COB in the cytoplasm but relatively little in the cell wall.
Co, cortex; CW, cell wall; Ep, epidermis; Go, Golgi. Bars = 250 nm.

