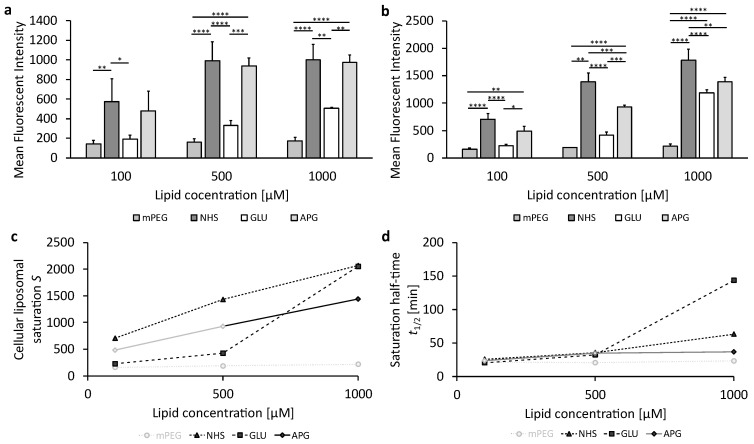
Figure 4.
The uptake of glucose-modified liposomes in bEnd.3 cells under complete glucose deprivation conditions. (a) Liposomal uptake in bEnd.3 cells after 1 h and (b) 3 h of treatment. The bars represent the mean values with the standard deviation as error bars. Statistical analysis: two-way ANOVA followed by Tukey’s multiple comparison test. * p < 0.05, ** p < 0.01, *** p < 0.001, **** p < 0.0001; n = 3. (c) The cellular liposomal saturation and (d) the corresponding saturation half-time t1/2 calculated according to Equation (1). In those cases where the exponential regression only produced r2 < 1, the mean fluorescence intensity (MFI) at 3 h is used as an approximation of the cellular saturation S, and these data are shown in faint grey. The data points in faint gray in (d) are calculated using approximate values for the exponential fit.

