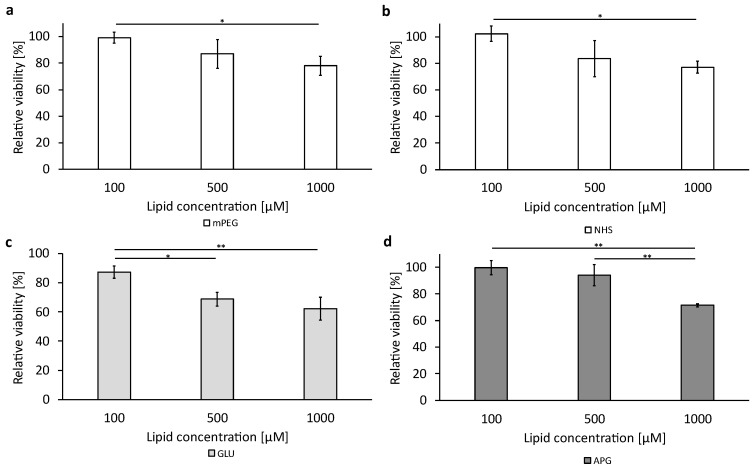
Figure 6.
Liposomal cytotoxicity on bEnd.3 cells using alamarBlue™ HS reagent. A representation of all different tested formulations: (a–d). The bars represent the mean values with the standard deviation as error bars. Statistical analysis: one-way ANOVA followed by Tukey’s multiple comparison test. * p < 0.05, ** p < 0.01; n = 3.

