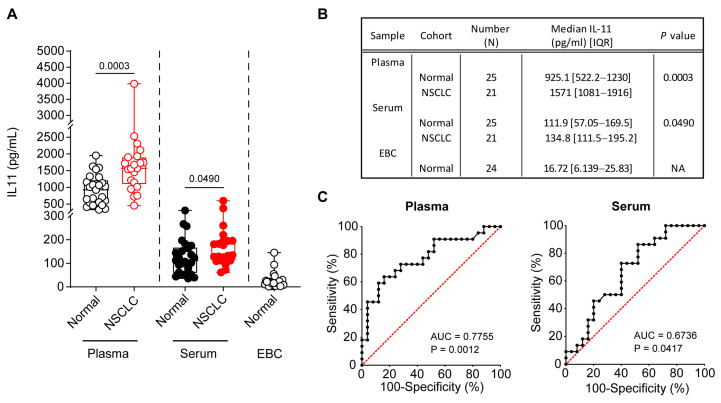
Figure 3.
High sensitivity IL-11 IQELISA in plasma, serum and EBC in normal individuals versus NSCLC patients. (A) Elevated plasma and serum IL-11 levels were observed in NSCLC compared to normal individuals. In addition to 24 normal EBC, all 25 normal and 21 NSCLC plasma and serum recorded a detectable IL-11 concentration with the high-sensitivity human IL-11 IQELISA kit (IQH-IL11, RayBio). Two-tailed Mann–Whitney test was conducted for statistical analyses. Open and closed symbols indicate plasma and serum, with normal in black and NSCLC in red, respectively. (B) Table depicting median IL-11 concentrations and interquartile ranges, respectively. (C) The ROC curve analysis for plasma and serum IL-11 to distinguish NSCLC patients from normal individuals. The dashed red lines represent the random classifier. (A,B) Data presented as median ± IQR with whiskers indicating minimum and maximum values. Two-tailed Mann–Whitney test was conducted for statistical analyses. (C) Wilson/Brown method was used to compute the confidence interval for statistical analyses.

