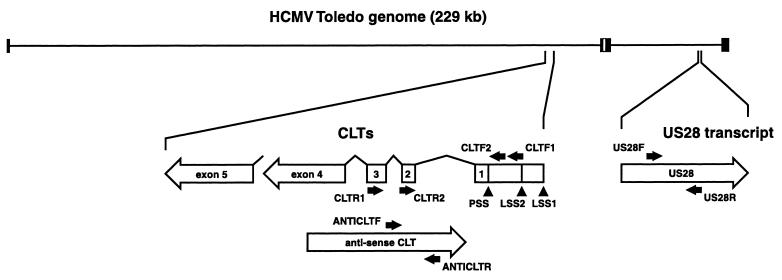
FIG. 1.
RT-PCR primers and their target transcripts. Schematic representation of the HCMV Toledo genome and the relative positions of the MIE gene and US28. Black boxes represent repeat regions of the Toledo genome. The US28-specific transcripts and CLTs are indicated below the genome at a smaller scale by open arrows. The positions and polarity of the US28-, as well as the CLT-specific RT-PCR primers (Table 1) are indicated by black arrows. Transcription starts of the sense CLTs (LSS1 and LSS2) and the PSS are indicated by arrowheads.

