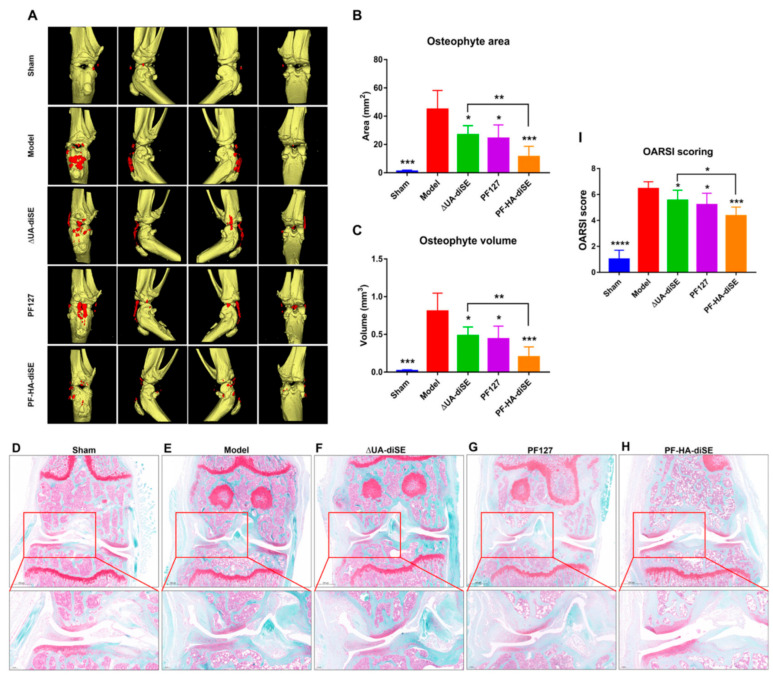
Figure 7.
(A) Computed tomography 3D images of knee joints treated 50 days with hydrogels, area (B) and volume (C) of osteophytes. * p < 0.05, ** p < 0.01, *** p < 0.001, n = 5. (D–H) Safranin staining of the paraffin sections of knee joints. An enlarged view is shown at the bottom of each image. (I) OARSI score of sections stained with safranin O-fast green. * p < 0.05, *** p < 0.001 and **** p < 0.0001, n = 5 [127].

