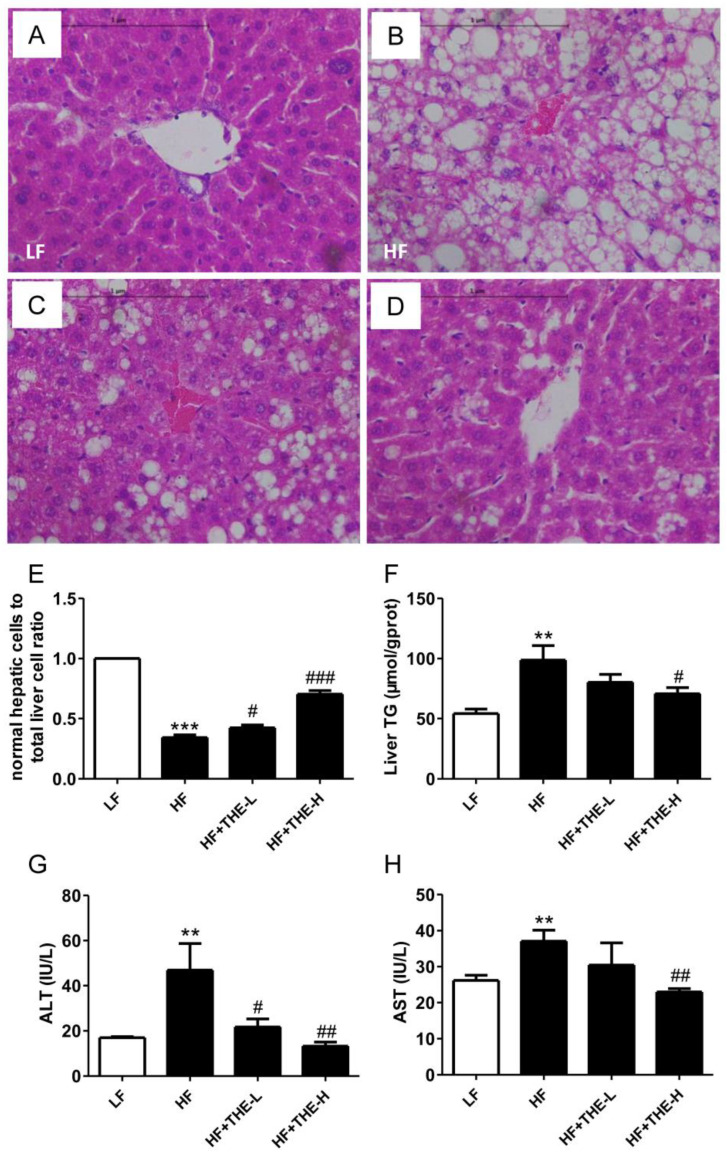
Figure 2.
THE improved hepatic steatosis in HFD-induced obese mice. (A–D) (600 dpi resolution) Histological examination of liver structure with HE staining in different groups of mice; (E) normal hepatic cell-to-total liver cell ratio (statistics were conducted by randomly selecting 5 fields of view from each tissue section); (F) TG levels in liver; (G,H) the activities of serum ALT and AST, respectively. ** p < 0.01, *** p < 0.001 versus LF group; # p < 0.05, ## p < 0.01, ### p < 0.001 versus HF group (n = 6, means ± SEM).

