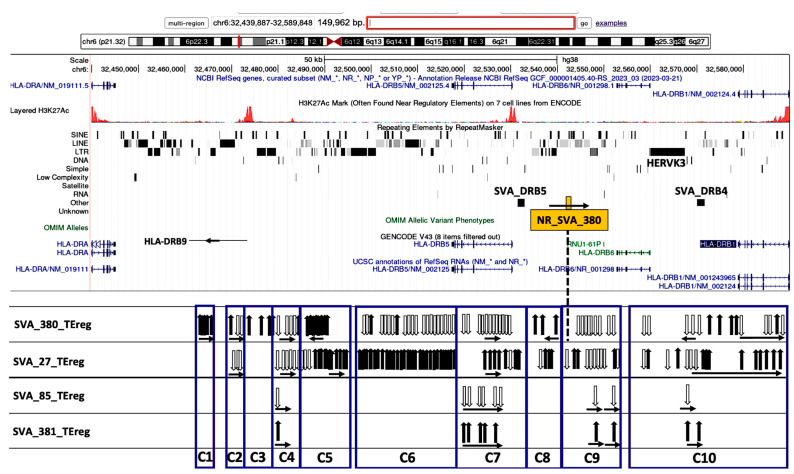
Figure 3.
Genomic loci map of expressed TE clusters C1 to C10 ranging across 150 kb from the HLA-DRA to the 5′ end of the HLA-DRB1 classical class II gene that are regulated by four different SVAs. Image of the genome browser is sourced from the University of California, Santa Cruz (UCSC) Genomics Institute, showing from the top towards the bottom, the scale for chr6:32,439,887–32,589,846 and selected tracks for NCBI reference genes, H3K27Ac mark, repeating elements, Genecode gene annotations, and UCSC RefSeq RNAs. The browser image is overlayed with the positions of NR_SVA_380 (orange box), SVA_DRB4, and SVA_DRB5. Below the browser image are the relative positions of expressed TEs (vertical arrows) within the boxed clusters C1 to C10 that are regulated by the labelled SVA elements, SVA_380, SVA_27, SVA_85, and SVA_381, within each horizontal panel. The black vertical arrows indicate upregulated TEs, and white vertical arrows indicate downregulated TEs. The horizontal arrows in each cluster group below the vertical arrows indicate the forward (left to right) or reverse (right to left) orientation of the TE loci.

