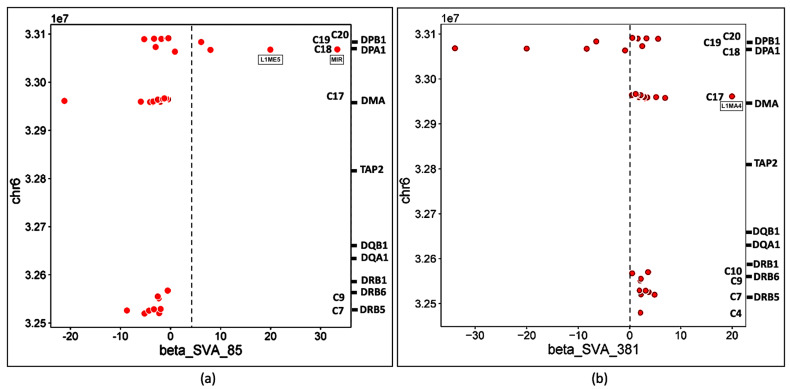
Figure 9.
Scatter plots of (a) R_SVA_85 and (b) NR_SVA_381 effects on TE expression using the TE chromosomal position (Y-axis, units of 1x10⁷) compared to the β expression effect (X-axis). The regulatory effects (β) of R_SVA_85 (a) and NR_SVA_381 (b) are for 39 and 38 TE transcript samples, respectively. The relative gene locations and clusters C are indicated on the right-sided Y axis of each (a,b). Upregulated TE outlier red circles L1ME5 and MIR (a) and L1MA4 (b) are labelled within the scatter plot matrices, respectively.

