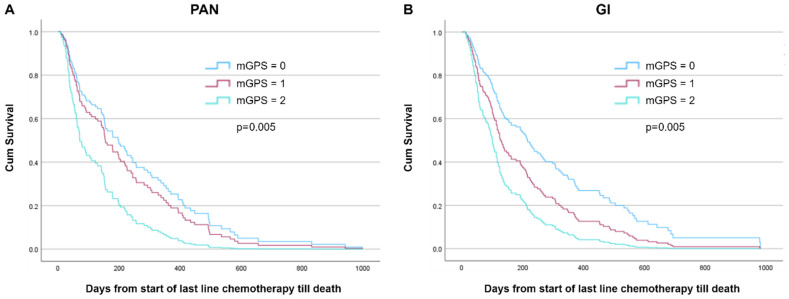
Figure 3.
Cox-adjusted survival curves from start of last-line chemotherapy until death by mGPS at baseline among patients with (A) pancreatic cancer (PAN; n = 107, p = 0.005) and (B) other gastrointestinal cancers (GI; n = 149, p = 0.005). Model adjusted for age, sex, hospital catchment area, performance status at baseline (2 categories, PS 2–3 vs. PS 0–1), and mGPS (0, CRP ≤ 10 [reference]; 1, CRP > 10; 2, CRP > 10 and alb < 35 g/L).

