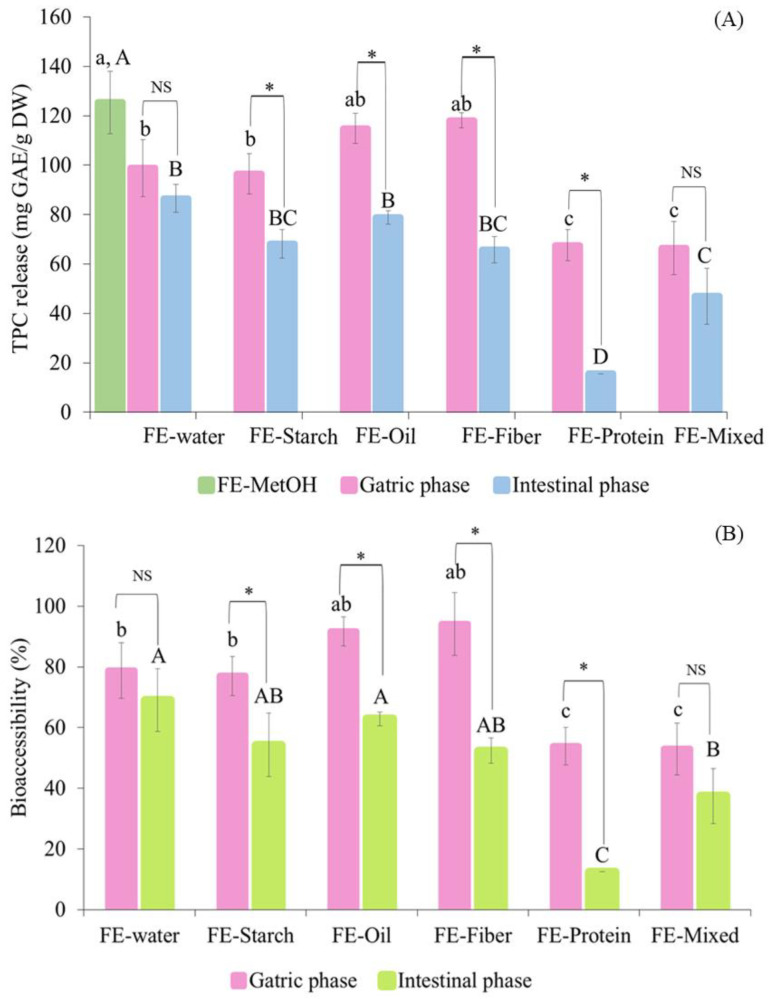
Figure 3.
The changes in total phenolic content release (mg GAE/g DW) and bioaccessibility (%) of white mugwort extract (FE) with food systems during in vitro gastrointestinal digestion. (A) represents TPC release and (B) represents percentage of bioaccessibility. Note: Values with different letters (A–D and a–c) within the same digestion phase and (*) between digestion phases are significantly different (p ≤ 0.05). Differences between the two digestion phases for each food system are labeled as insignificantly different (NS) or significantly different (*) at p < 0.05.

