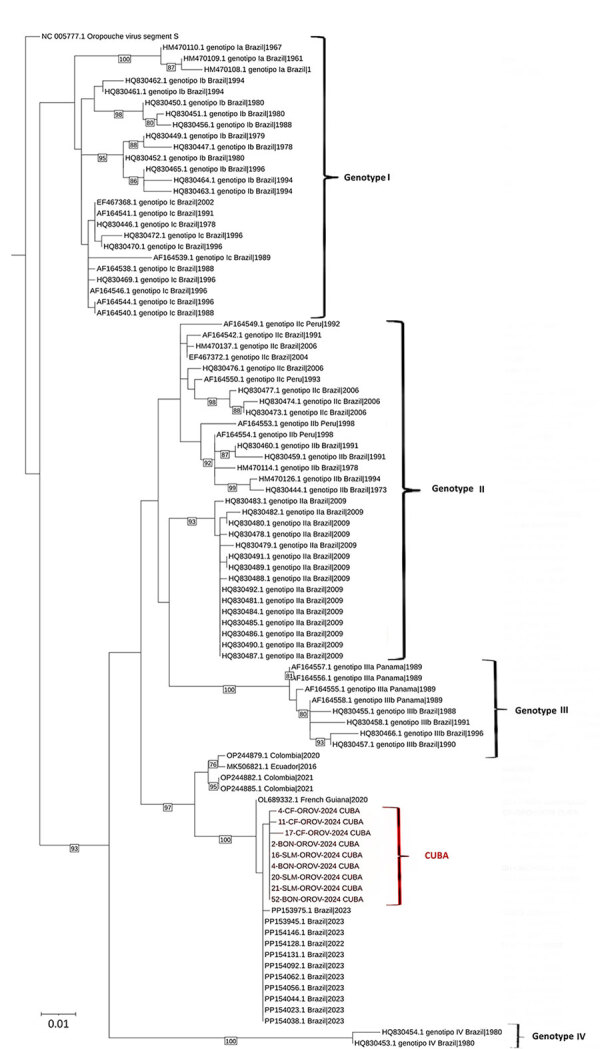
Figure 1.

Molecular phylogenetic analysis of Oropouche viruses isolated in Cuba (red bracket) and reference sequences. The evolutionary history was inferred by using the maximum-likelihood method based on the Kimura 2-parameter model to the small segment of Oropouche orthobunyavirus from 9 patients from Boniato, Songo La Maya, and Cienfuegos (PP921382, PP921383, PP921384, PP921385, PP921386, PP921387, PP921388, PP921389, PP921390) (14). The tree with the highest log likelihood (−2,403.4997) is shown. The percentage of trees in which the associated taxa clustered together is shown next to the branches. Initial tree(s) for the heuristic search were obtained by applying the neighbor-joining method to a matrix of pairwise distances estimated by using the maximum composite likelihood approach. A discrete gamma distribution was used to model evolutionary rate differences among sites (5 categories [+G, parameter = 0.1407]). The tree is drawn to scale, with branch lengths measured in number of substitutions per site. The analysis involved 101 nt sequences deposited in GenBank (accession numbers shown) from the different outbreaks and genotypes of Oropouche virus in the Americas and the Caribbean region. All positions with <95% site coverage were eliminated (i.e., <5% alignment gaps, missing data, and ambiguous bases were allowed at any position) The final dataset contained 521 positions. Evolutionary analyses were conducted in MEGA6 (13).
