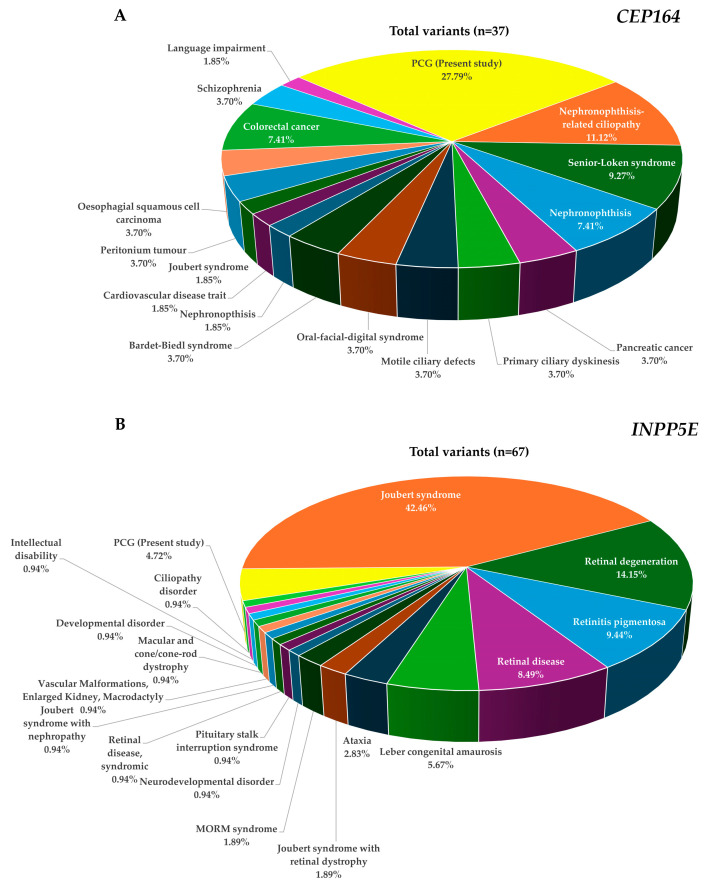
Figure 4.
Pie charts depicting the proportions of observed pathogenic variants in CEP164 (A) and INPP5E (B) across different phenotypes and the present study (PCG). The data show the frequencies of the classified disease mutations as per the HGMD database (Tables S3 and S4).

