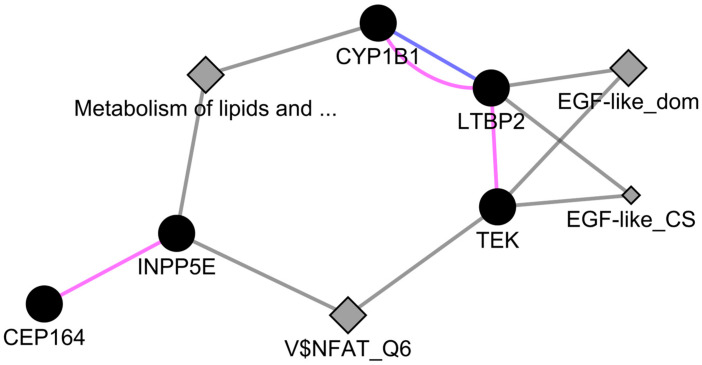
Figure 5.
Network analysis of CEP164 and INPP5E with PCG-associated candidate genes. The network was generated using GeneMania of Cytoscape v3.5.3 software. Solid nodes represent genes. Diamond nodes represent the consolidated pathways, domains and transcription factor targets. Color scheme: Pink = Co-expression, Blue = Co-localization, Grey = Shared attribute. “V$NFAT_Q6” = Transcription factor target motif, “EGF-like_dom” = EGF-like domain, “EGF-like_CS” = EGF-like conserved site, “Metabolism of lipids and …” = Metabolism of lipids and lipoproteins.

