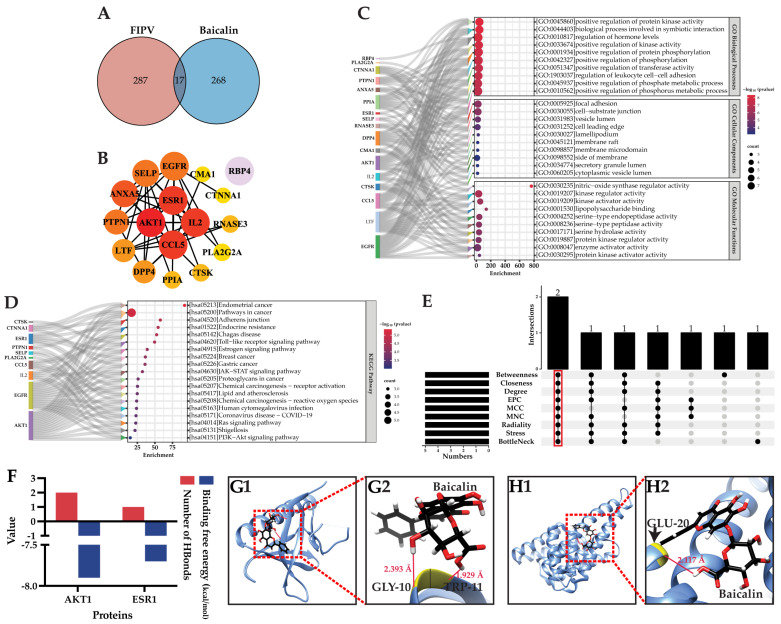
Figure 4.
(A) Venn diagram of baicalin target-FIPV targets; (B) PPI network of potential targets; (C) Sankey bubble plot of GO functional enrichment results; (D) Sankey bubble plot of KEGG pathway enrichment results; (E) results of topological analysis; (F) results of molecular docking binding free energy and number of hydrogen bonds; (G1,H1) overall maps of baicalin docked with AKT1 and ESR1, respectively; (G2,H2) local maps of baicalin docked with AKT1 and ESR1, respectively.

