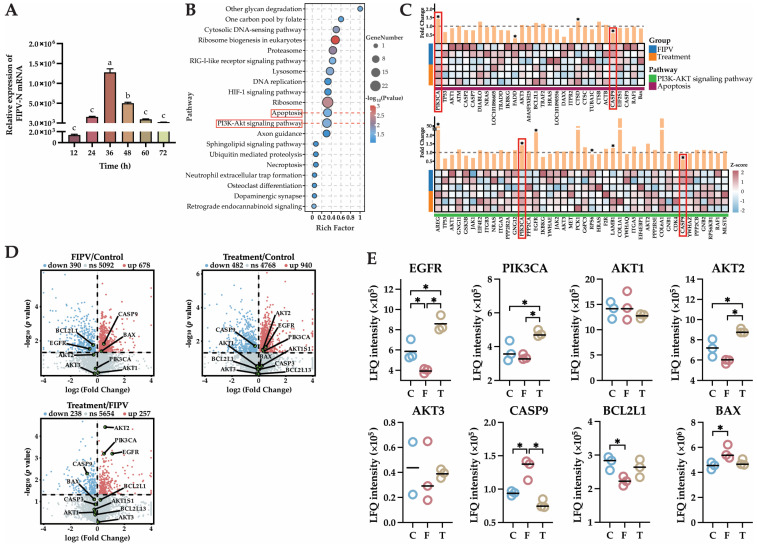
Figure 5.
(A) results of viral load in cells treated with baicalin for different durations. (B) KEGG pathway enrichment bubble map. (C) Heatmap and fold change map of the PI3K-AKT signaling pathway and apoptosis pathway. (D) Volcano plots of DEPs in the three comparative groups of FIPV/control, treatment/control, and treatment/FIPV, in which the key proteins EGFR, PIK3CA, AKT1, AKT2, AKT3, CASP9, BLC2L, and BAX in the PI3K-AKT signaling pathway and apoptosis pathway were locally annotated with green dots. (E) 4D-LFQ proteomics quantitative analysis results of the key proteins in the PI3K-AKT signaling pathway and apoptosis pathway: EGFR, PIK3CA, AKT1, AKT2, AKT3, CASP9, BLC2L1, and BAX. The red boxes are the focus of this research. The data are represented as the mean ± SEM (n = 2–3). Different lowercase letters (a–c) and “*” indicate significant differences between groups, p < 0.05.

