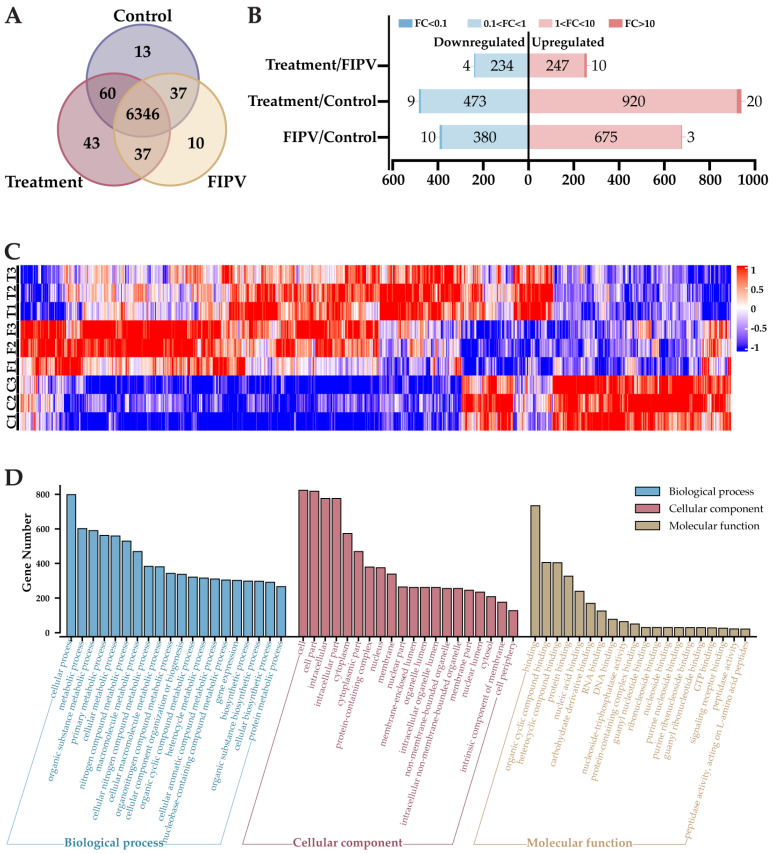
Figure A1.
Results of proteomic analysis: (A) Venn diagram of proteins detected in control, treatment, and FIPV groups; (B) DEPs among the treatment/FIPV, treatment/control and FIPV/control groups; (C) DEP clustering results of groups C, F, and T. Control or C is the cell control group; treatment or T is the baicalin-treated group; and FIPV or F is the viral control group, the same as below. (D) GO functional enrichment results.

