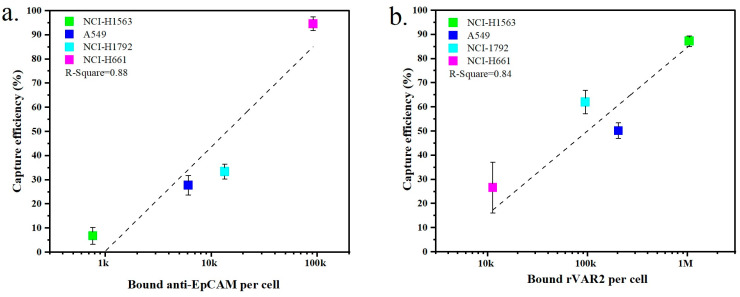
Figure 5.
Comparison of the capture efficiency of NSCLC cell lines in lysed blood using (a) anti-EpCAM antibody or (b) rVAR2. Each data point represents the mean capture efficiency for a specific cell line, with whiskers indicating the standard deviation (SD) from three replicates (n = 3). The cell lines tested include NCI-H1563, A549, NCI-H1792, and NCI-H661. The correlation between capture efficiency and the number of bound molecules per cell is shown, with R-squared values indicating the fit of the regression lines.

