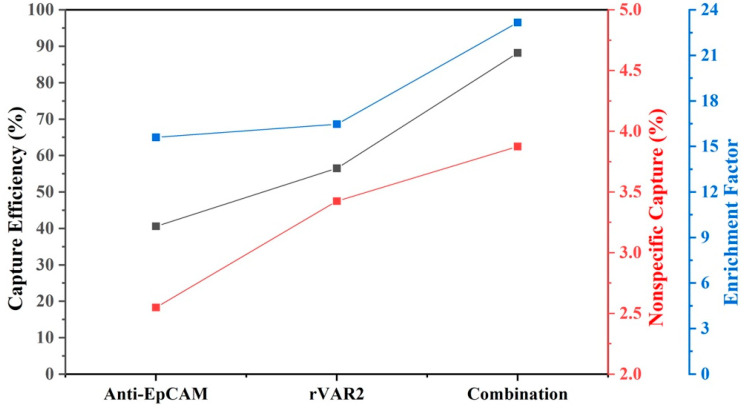
Figure 7.
Average capture efficiency, nonspecific capture, and enrichment factor for four NSCLC cell lines using different enrichment conditions: anti-EpCAM, rVAR2, and their combination. The results assume equal amounts of each cell line prior to enrichment. The left y-axis (black) represents capture efficiency (%), the middle y-axis (red) represents nonspecific capture (%), and the right y-axis (blue) represents the enrichment factor. The combination of anti-EpCAM and rVAR2 shows improved performance across all metrics compared with using either marker alone.

