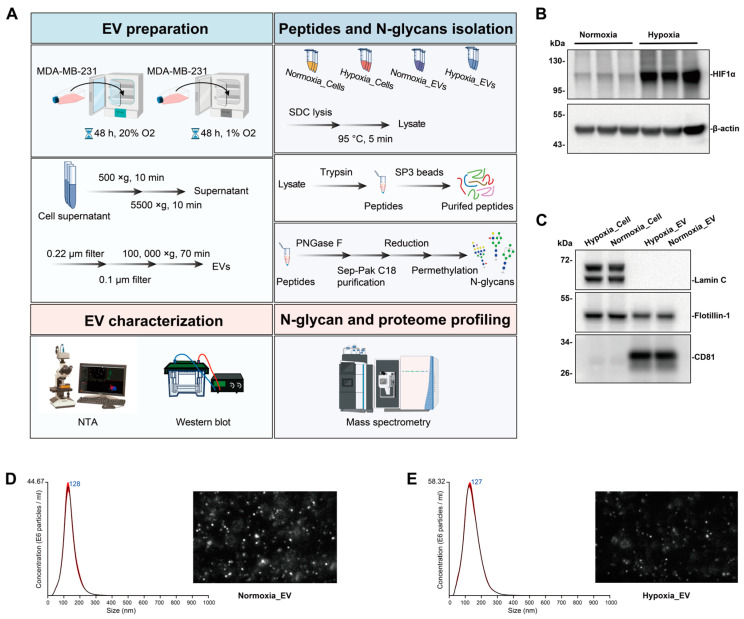
Figure 1.
EV isolation and characterization. (A) Workflow for preparing EVs and conducting mass spectrometry for proteomic and N-glycomic analyses of EVs and cells. Key steps include enrichment of EVs secreted under normoxic or hypoxic conditions, isolation of peptides and N-glycans, EV characterization, and mass spectrometry analysis. (B) Western blot of hypoxic marker HIF1α in normoxic and hypoxic cell lysate. (C) Western blot of EV markers CD81, Flotillin-1, and Lamin C in normoxic and hypoxic EV lysate and cell lysate. (D,E) Size and concentration of EVs secreted under normoxia or hypoxia for MDA-MB-231 cell line, as measured by NTA. Histogram showing the calculated mean ± SD of size distribution by NTA analysis of normoxic and hypoxic EV. Red error bars indicate ± 1 standard error of the mean. Screenshots from video recorded using NanoSight LM14, showing the distribution of EVs from the cellulose-supernatant culture under normoxia or hypoxia. Three biological replicates were used for each condition.

