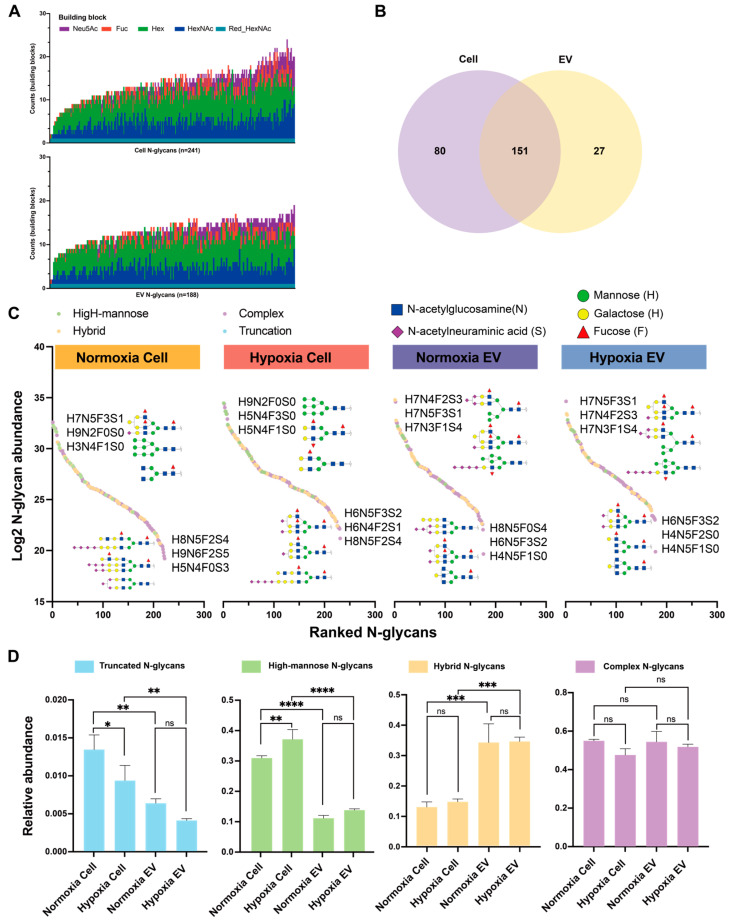
Figure 2.
Overview of the N-glycome profiles of EVs and cells under normoxic and hypoxic conditions of the MDA-MB-231 cell line. (A) The stacked bar chart of identified N-glycan compositions in cells (n = 6) and EVs (n = 6). The counts indicate the number of each monosaccharide building block present in the N-glycan structures. (B) A Venn diagram illustrating the number of N-glycans shared between cells and EVs. (C) All quantified N-glycans are plotted, depicting their log-transformed relative abundances against their rank within the dynamic range. (D) Distribution of common N-glycosylation features in cells and EVs under normoxic and hypoxic conditions. Significant values are marked with ns (no significant), * (p ≤ 0.05), ** (p ≤ 0.01), *** (p ≤ 0.001), or **** (p ≤ 0.0001).

