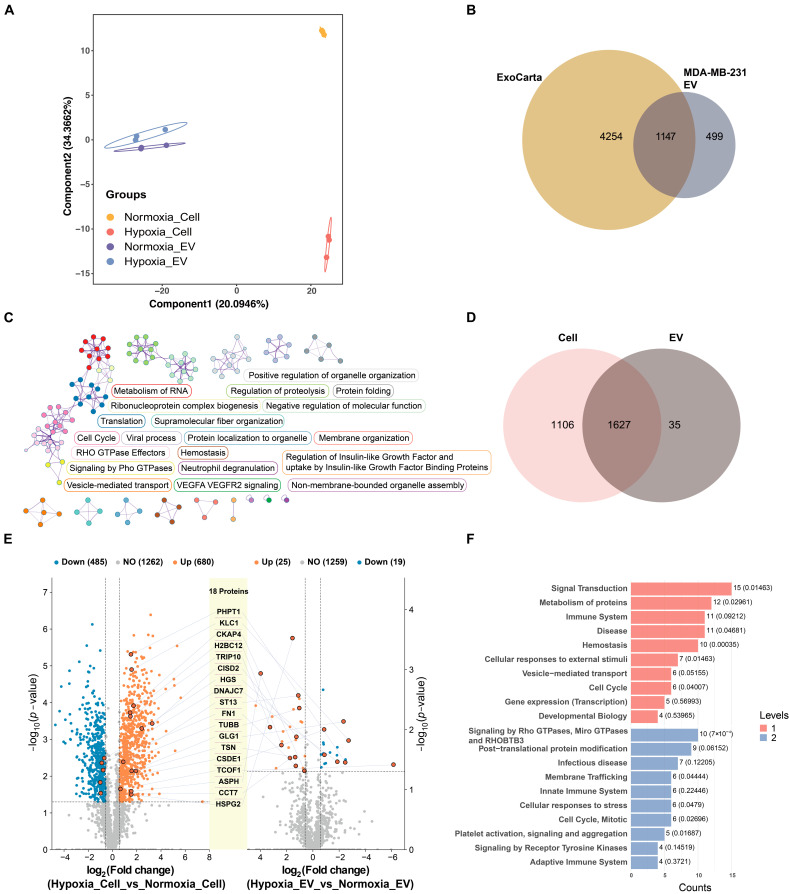
Figure 4.
Proteomic analysis of EVs and cells under normoxic and hypoxic conditions. (A) Scatter plot of PLS-DA analysis of proteome profiles of normoxia_Cell (yellow circles), hypoxia_Cell (orange circles), and normoxia_EV and hypoxia_EV (purple and cyan squares). Symbols and ellipses indicate each sample and the 95% confidence interval of the four clusters. R2Y = 0.661; Q2Y = 0.574; p = 0.05. (B) Venn diagram showing comparison of protein groups identified in MDA-MB-231 cell EVs by LC–MS/MS with ExoCarta, a public EV proteomics database. Overlapping parts represent shared proteins, and non-overlapping parts represent unique proteins. (C) The network displays enriched biological pathways identified from EV proteome using Metascape. Nodes represent enriched terms, edges denote similarities, and colors indicate cluster IDs, highlighting different functional groups. (D) Venn diagram shows protein groups identified in cells and EVs using LC–MS/MS procedures (n = 6 per group). (E) Volcano plots showing differentially expressed proteins between normoxic and hypoxic conditions in both cells and EVs (p < 0.05 and fold change > 1.5; q-value < 0.05). The left panel presents a volcano plot of differentially expressed proteins between normoxic and hypoxic cells, while the right panel shows the differentially expressed proteins between normoxic and hypoxic EVs. The central diagram highlights the overlapping differentially expressed proteins identified in both conditions. (F) The top 20 entries of the Reactome pathway enriched for levels 1 and 2 by the differentially expressed proteins between normoxic and hypoxic EVs. Levels 1 and 2 indicate distinct biological themes enriched in the dataset.

