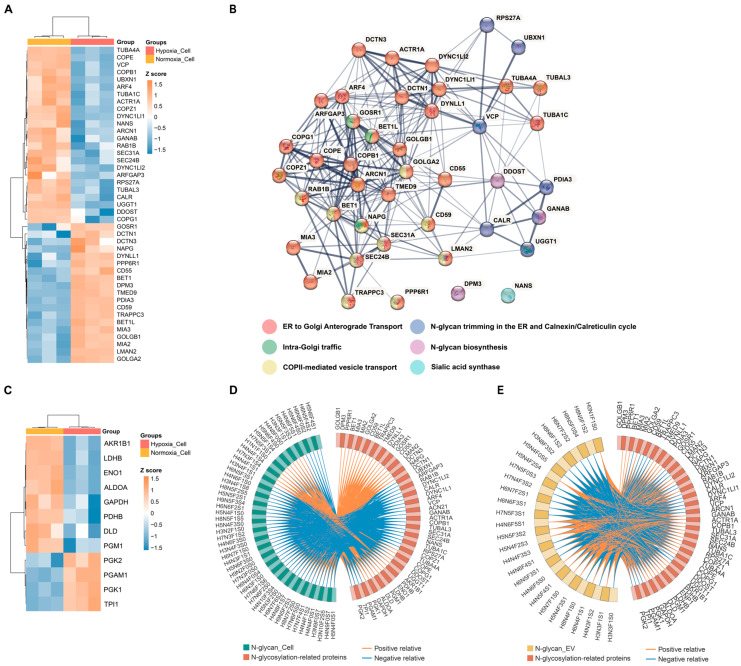
Figure 5.
The expression profile and functional enrichment of glycosylation-related proteins in normoxic and hypoxic cells. (A) Heatmap of the differentially expressed “Asparagine N-linked glycosylation” proteins in hypoxic cell compared to normoxic cell. (B) STRING network analyses of significant differentially abundant proteins involved in asparagine N-linked glycosylation. (C) Heatmap of the differentially expressed glycolysis/gluconeogenesis proteins in hypoxic cell compared to normoxic cell. (D,E) Correlation Circos plot of differentially expressed N-glycans in EVs and cells under normoxic and hypoxic conditions and dysregulated N-glycosylation-related proteins in cells. Pearson coefficient cut-offs set at ≥0.8 or ≤−0.8. Blue lines represent negative correlations, while orange lines represent positive correlations.

