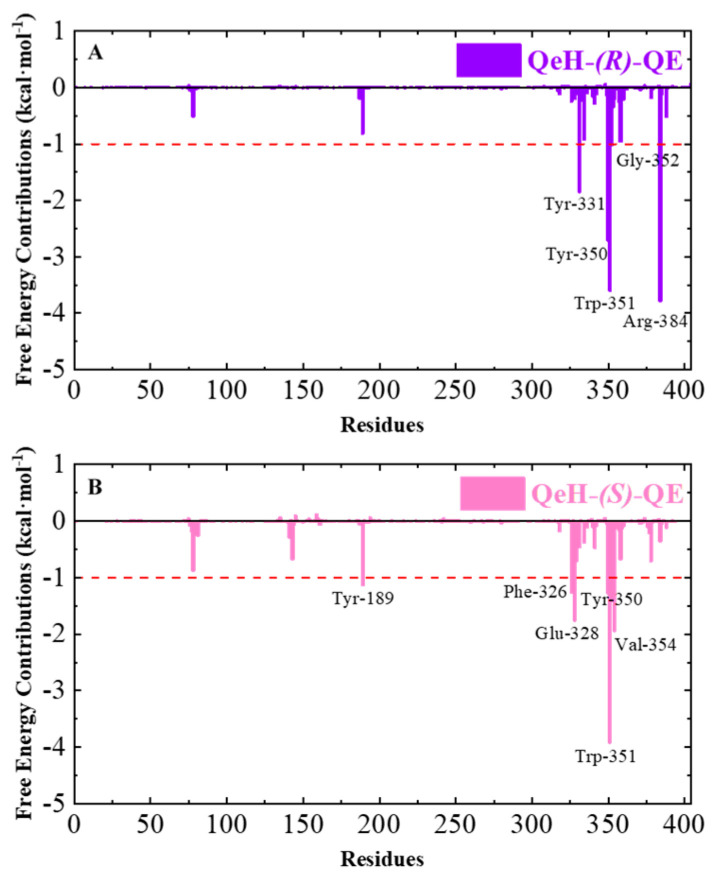
Figure 5.
The total binding free energy (∆Gbind) contributions of the QeH-(R)-QE (A) and QeH-(S)-QE (B) complexes. Each residue for the QeH-(R)-QE and QeH-(S)-QE complexes calculated from the equilibrated conformations during independent MD runs. The residues contribution exceeding −1.00 kcal·mol−1 to the binding free energy were marked with red dashed lines.

