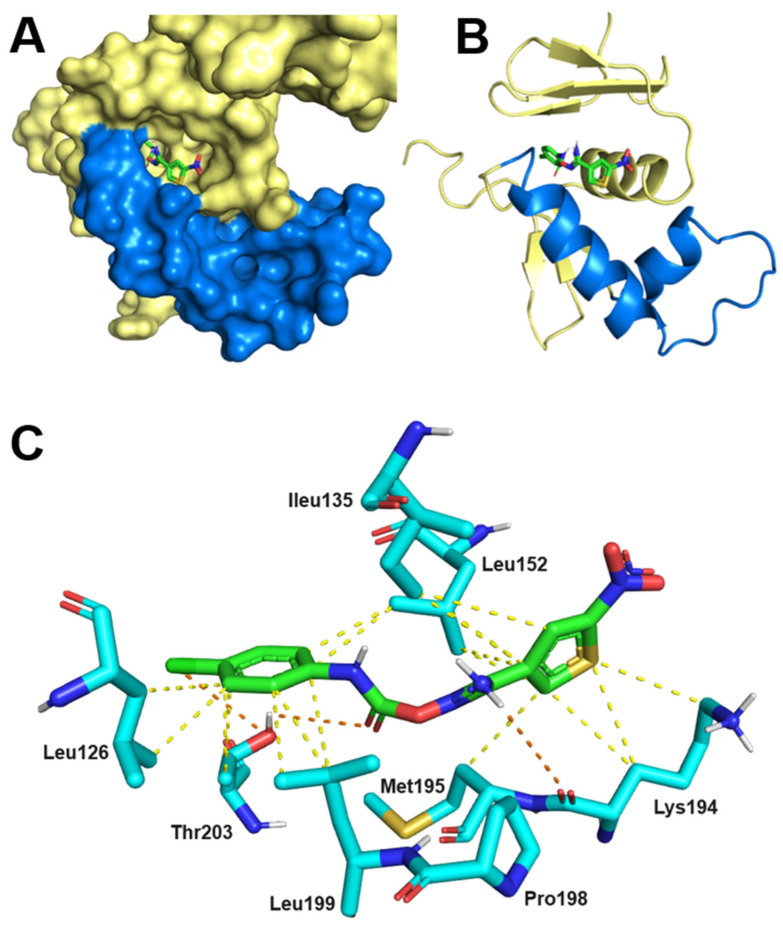
Figure 6.
Predicted model of molecular interaction between HsrA and ligand V. (A) 3D view (molecular surface) and (B) ribbon diagram of the HsrA effector domain and the best-ranked docking pose of ligand V. The helix-turn-helix (HTH) DNA binding motif has been highlighted in blue. (C) Detailed view of the amino acid residues directly involved in the interaction of HsrA with ligand V. Hydrophobic interactions are indicated with yellow dashed lines, H-bonds and halogen bonds are indicated with orange dashed lines. Molecular docking analysis was performed by AutoDock Vina “vina.scripps.edu (accessed on 19 September 2024)”. Protein-ligand complex was visualized by PyMOL “www.pymol.org (accessed on 19 September 2024)”.

