Figure 2.
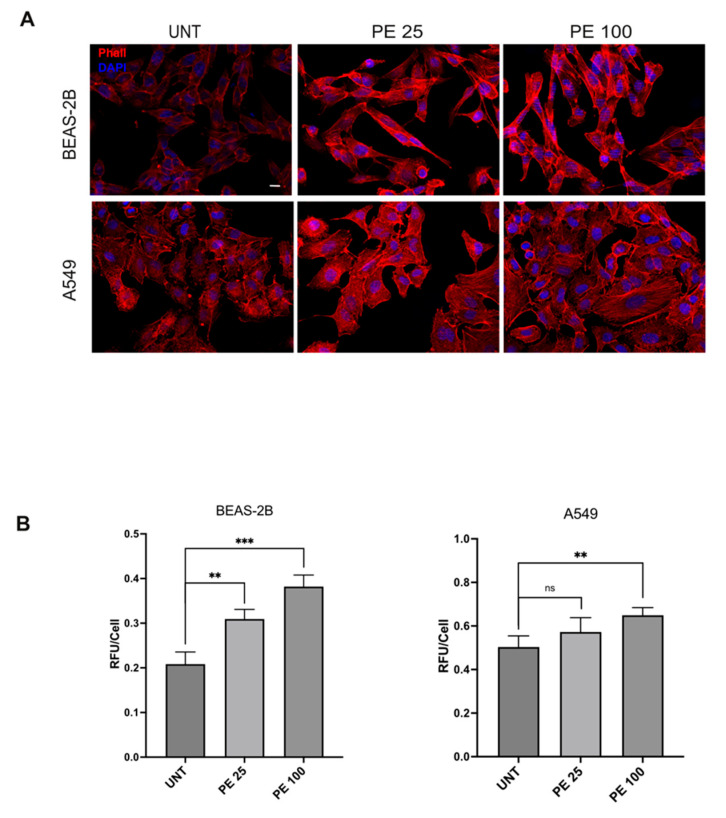
Immunofluorescence analysis of the effects of acute PE MNPs exposure on actin cytoskeleton architecture in BEAS-2B and A549 cells. (A) Representative IF acquisitions (N = 3) showing actin cytoskeleton of BEAS-2B and A549 cells treated with PE MNPs (PE 25 and PE 100) or untreated (UNT). F-Actin is stained in red with TRITC-Phalloidin and nuclei are stained in blue with DAPI. Bar: 10 μm. (B) Quantitative immunofluorescence analysis of TRITC-Phalloidin staining, expressed as the mean ± SD relative fluorescence unit per cell (RFU/cell). ns, not statistically significant; **, p < 0.01; ***, p < 0.001.

