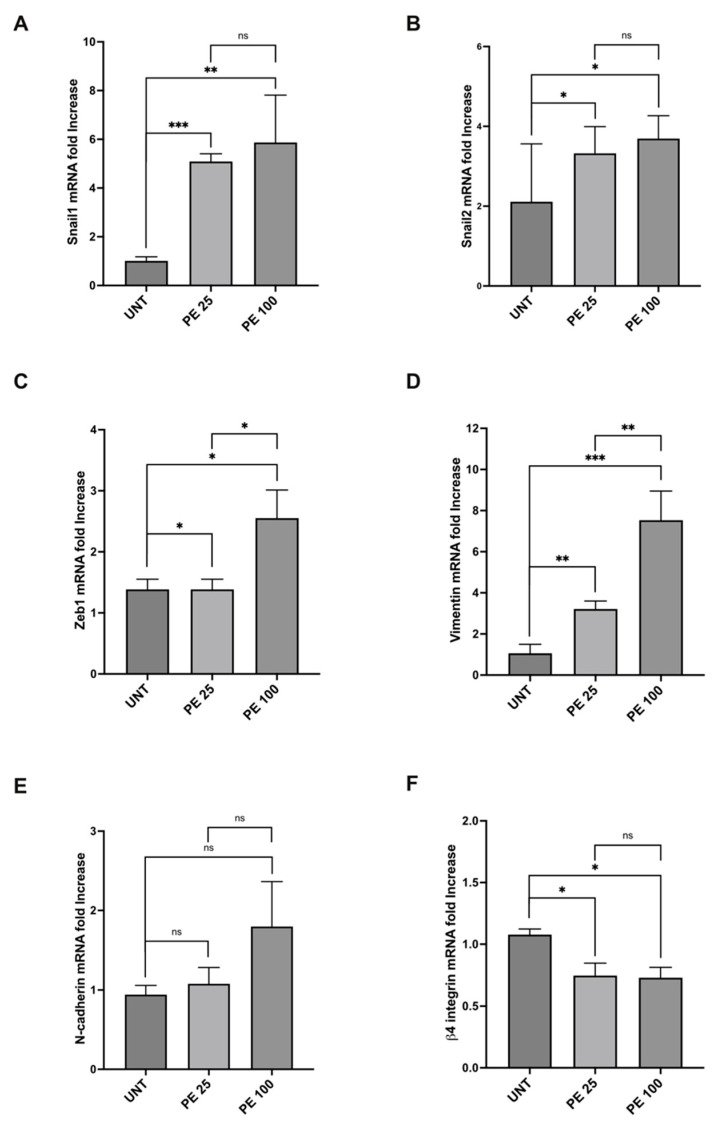
Figure 3.
Modulation of mRNA expression levels of EMT markers after acute PE MNPs exposure in BEAS-2B cells. (A–F) Bar graphs (N = 3) showing gene expression levels of the EMT markers Snail1 (A), Snail2 (B), Zeb1 (C), and of the epithelial/mesenchymal markers vimentin (D), N- cadherin (E), β4-Integrin (F) in BEAS-2B cells, treated for 24 h with PE MNPs (PE 25 and PE 100), compared to untreated cells (UNT). Results are expressed as mean value ± SD. ns, not statistically significant; *, p < 0.05; **, p < 0.01; ***, p < 0.001.

