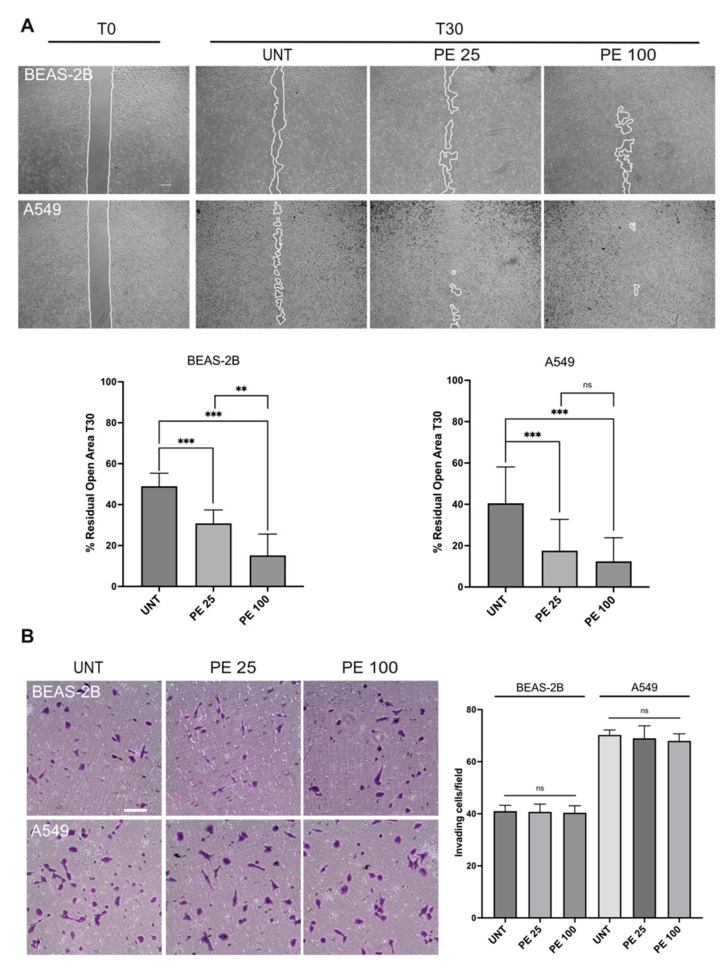
Figure 8.
Effects of PE MNPs exposure on BEAS-2B and A549 migration and invasiveness abilities. (A) Representative images of scratch assay (N = 3) showing the effect of PE MNPs on BEAS-2B and A549 migration. Bar: 500 μm. The percentage of residual open area after 30 h of treatment with PE MNPs (PE 25 and PE 100), compared to that of untreated cells (UNT), was measured via ImageJ 1.54j software. Results are expressed as mean value ± SD. ns, not statistically significant; **, p < 0.01; ***, p < 0.001. (B) Representative images and quantification of transwell invasion assay (N = 3) on BEAS-2B and A549 treated with PE MNPs (PE 25 and PE 100) for 24 h or untreated (UNT). Migrated cells were stained with crystal violet. Bar: 100 μm. Invasiveness was calculated by counting the number of migrated cells as reported in the Material and Methods section. Results are expressed as mean value ± SD. ns, not statistically significant.

