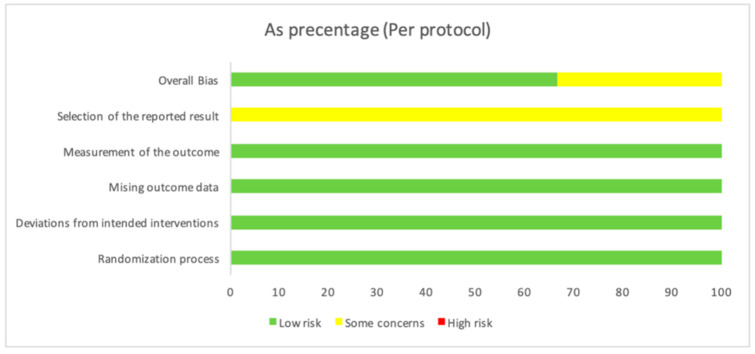
Figure 2.
The overall bias as a percentage. In the first row, there is a 66.7% value in green, indicating a low risk, while, in yellow, there is a value of 33.3%, indicating some concerns. The second row shows a value of 100% in yellow, indicating some concerns about the “Selection of the reported result”. For the other evaluated variables, there is a value of 100, indicating a low risk.

