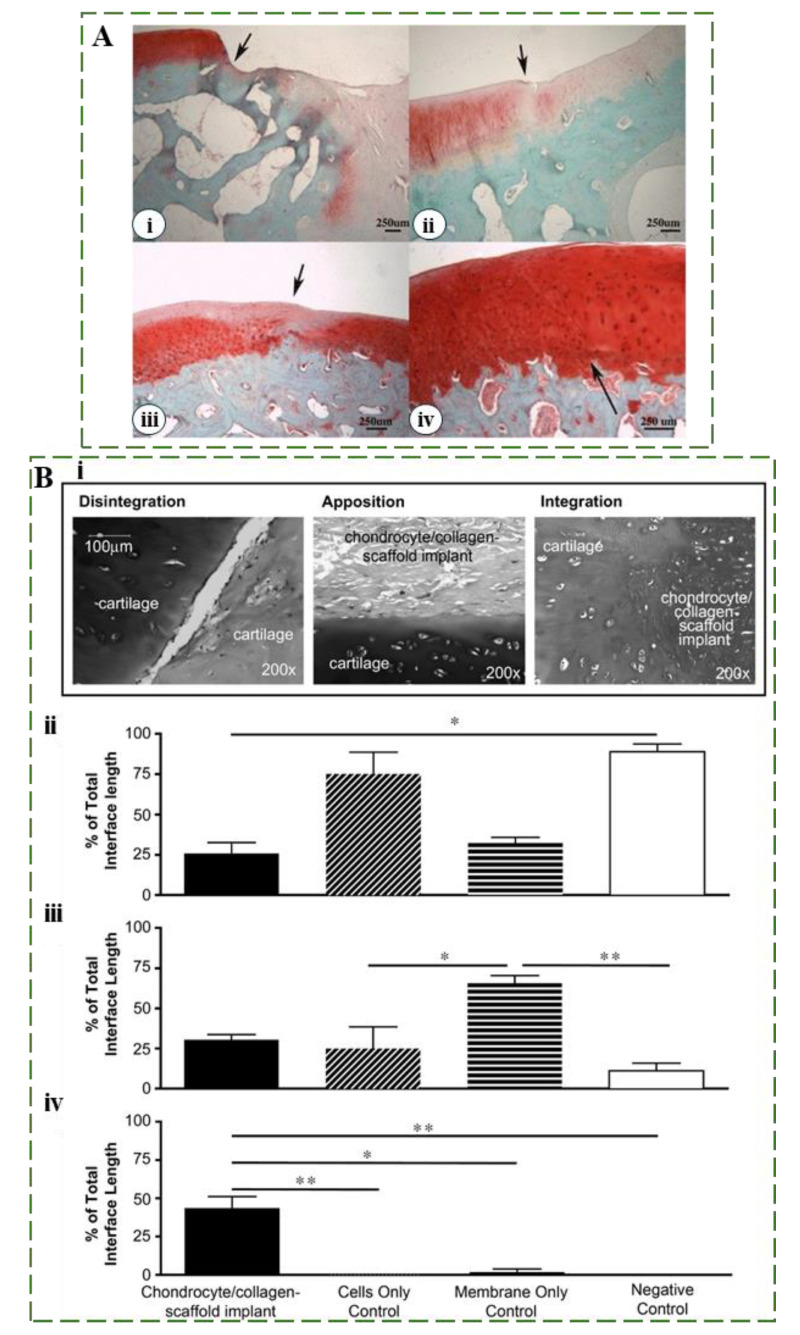
Figure 4.
(A) Representative Safranin O-stained sections depicting varying grades of integration with native cartilage. Black arrows highlight the junction area: (i) Poor integration, no tissue fusion; (ii) Integration with hypocellularity and surface fissuring; (iii) Enhanced integration with residual hypocellularity; (iv) Excellent integration; Reproduced with permission from Ref. [101], Copyright 2014, Springer. (B) Schematic representation of integration examination for repaired and native cartilage. Cartilage integration facilitated by a chondrocyte/collagen-scaffold implant system: Chondrocytes seeded onto a collagen membrane formed the implant, positioned between two cartilage discs. Histomorphometric analysis compared how well different groups integrated along the interface after 40 days: implanted chondrocytes, cells-only, membrane-only, and negative controls. Integration quality was categorized into disintegration, apposition, and integration percentages across the interface length. Statistical analysis was reported using the Kruskal–Wallis non-parametric ANOVA, fol-lowed by the Mann–Whitney U-test with a Dunn post hoc correction for multiple compar-isons. * p < 0.05; ** p < 0.01. Comparisons not marked with an asterisk are not statistically significant. Reproduced with permission from [102], Copyright 2009 Elsevier Ltd.

