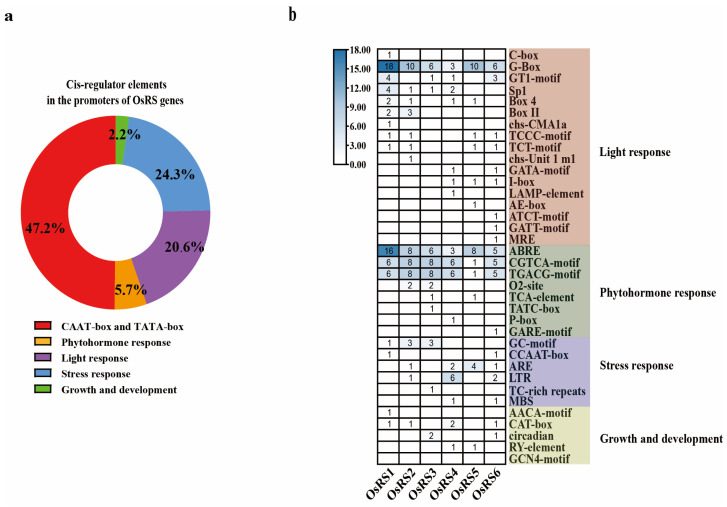
Figure 2.
Analysis of cis-acting elements of the OsRS gene. (a) Distribution and proportion of cis-acting elements in the promoter region of the OsRS gene; different colors represent different proportions. (b) Heatmap analysis of cis-acting elements in the promoter region of OsRS genes. In the heatmap, the numerical values represent the quantity of different cis-acting elements, with darker colors indicating higher quantities.

