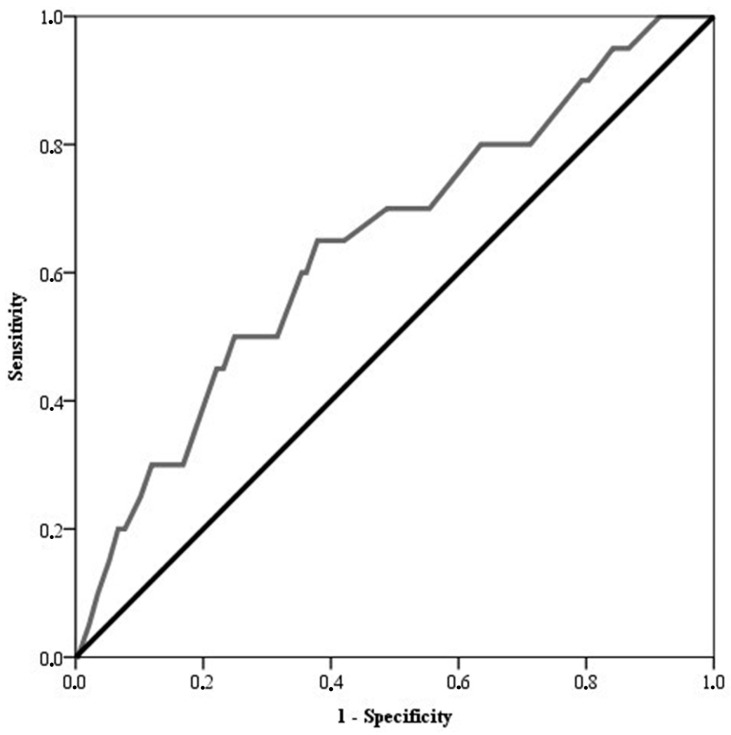
Figure 1.
ROC curve describing the discriminant power of the liver stiffness value (kPa) based on the risk of developing late HCC in cirrhotic patients [n = 306, AUROC score = 0.646, 95% C.I.: 0.519–0.774]. The p value for the significance of liver stiffness based on the risk of HCC was 0.029 (Kruskal–Wallis test).

