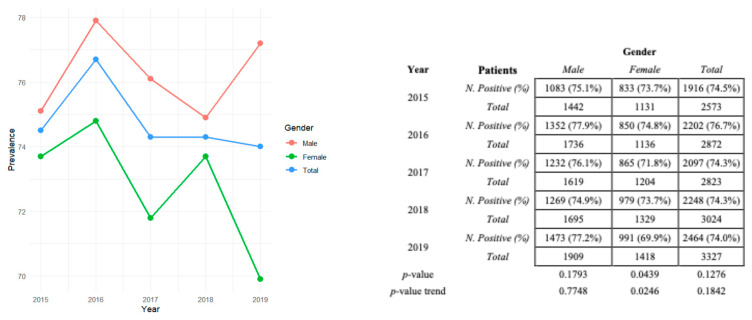
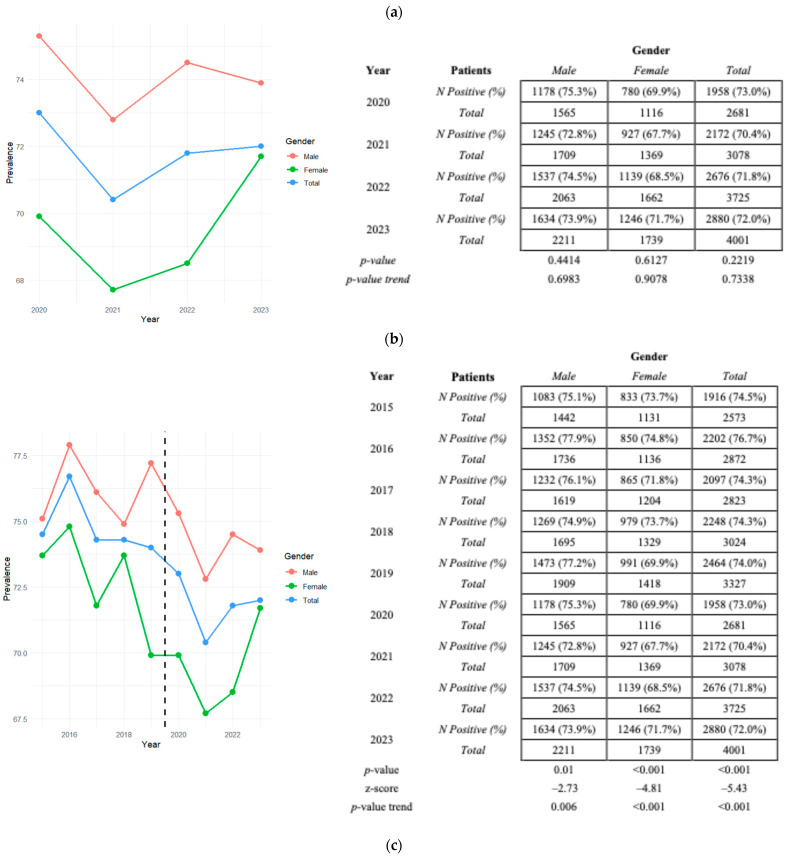
Figure 1.
Graphical representation of HAV seropositivity prevalence stratified for the male and female genders and total (male + female + total) in (a) 2015–2019, (b) 2020–2023, and (c) 2015–2023. The relative p-value and p-value trends in the (a) pre-pandemic and (b) pandemic periods are also reported. Z-scores in (c) represent the trend direction.


