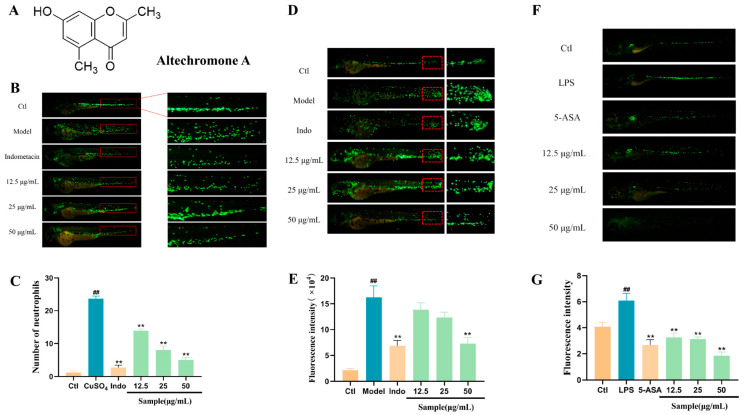
Figure 1.
Anti-inflammatory effect of Altechromone A. The results were subjected to analysis using one-way analysis of variance followed by Dunnett’s post hoc t-test. ## p ≤ 0.01 vs. Ctl, ** p ≤ 0.01 vs. model. (A) Chemical structure of Altechromone A. (B) Effect of Altechromone A on number of neutrophils in CuSO4-induced acute inflammation model. (C) Images of migration and aggregation of neutrophils, suggested by GFP. The migrated cells were explored in red area. The bar graph counts the number of migrating and aggregated neutrophils. (D) Effect of Altechromone A on the fluorescence intensity of neutrophils in tail amputation model. (E) Images of migration and aggregation of neutrophils, suggested by GFP. The migrated cells were explored in red area. The bar graph counts the fluorescence intensity (RFU) for migrating and aggregated neutrophils. (F) Effect of Altechromone A on the fluorescence intensity of neutrophils in LPS-induced systemic inflammation model. (G) Images of migration and aggregation of neutrophils, indicated by GFP. The bar graph counts the fluorescence intensity (RFU) for migrating and aggregated neutrophils.

