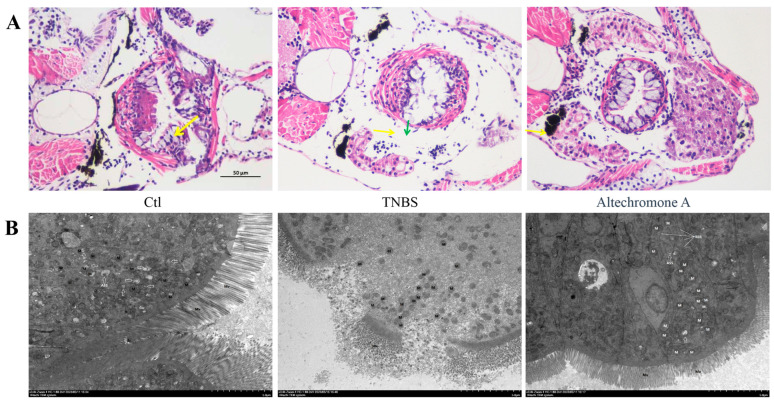
Figure 4.
Effect of Altechromone A on intestinal structure in TNBS-induced IBD models. (A) Representative H&E-stained cross-sections; the yellow arrow display the goblet cells and the green arrow is the secretion of goblet cells. (B) The transmission electron microscope photographs. The results were subjected to analysis using one-way analysis of variance followed by Dunnett’s post hoc t-test. Arrows indicate that the rough endoplasmic reticulum (rER) was not significantly expanded, and the ribosomes attached to its surface did not detach.

