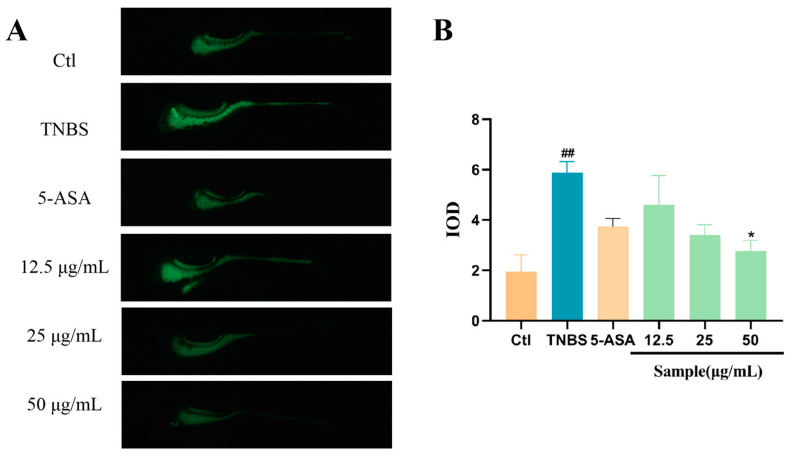
Figure 5.
Effect of Altechromone A on content of ROS in TNBS-induced IBD model. (A) Images stained with ROS. (B) Quantitation of integrated optical density (IOD) parameter of ROS. The results were subjected to analysis using one-way analysis of variance followed by Dunnett’s post hoc t-test. ## p ≤ 0.01 vs. Ctl, * p ≤ 0.05 vs. model.

