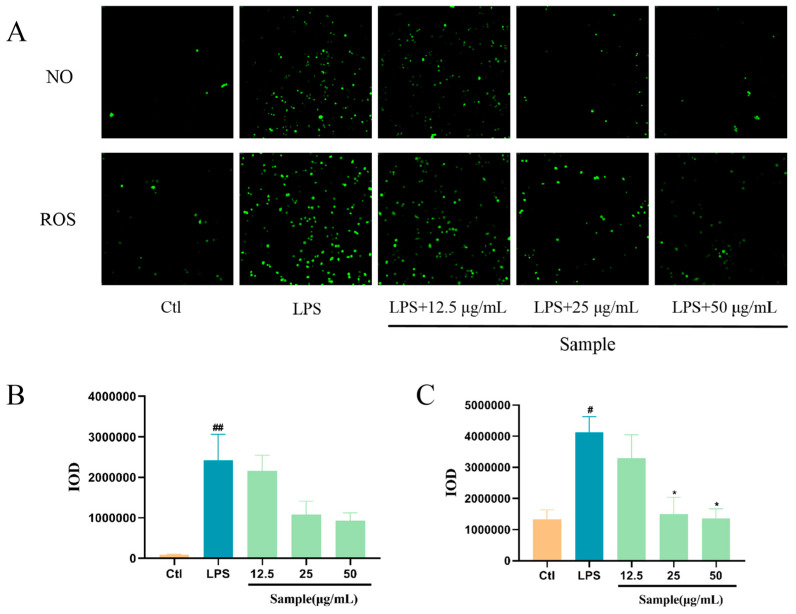
Figure 8.
Effect of Altechromone A on NO and ROS levels in LPS-induced RAW264.7 cell model. ## p < 0.01 vs. Ctl. (A) NO and ROS cell staining images. (B) Quantification of the integral optical density (IOD) parameter of NO. (C) Quantification of integrated optical density (IOD) parameters for ROS. The results were subjected to analysis using one-way analysis of variance followed by Dunnett’s post hoc t-test. # p ≤ 0.05 vs. Ctl, ## p ≤ 0.01 vs. Ctl, * p ≤ 0.05 vs. model.

