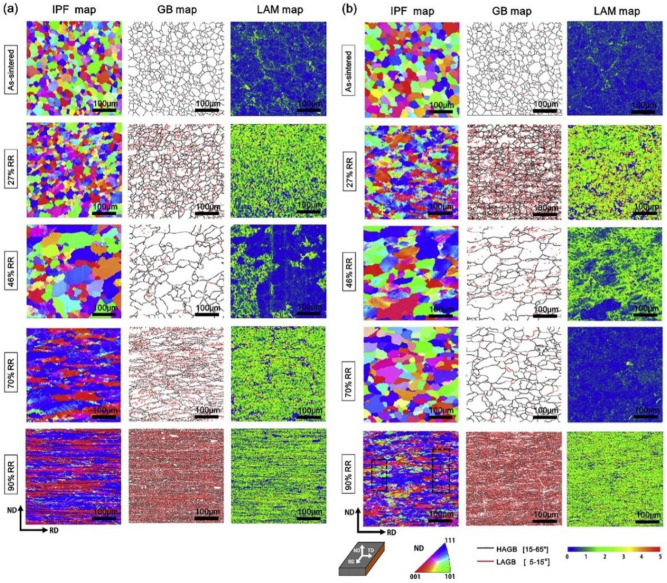
Figure 7.
EBSD maps of the hot-rolled pure W (a) and doped W (b) under various rolling reductions (RR = 0%, 27%, 46%, 70%, 90%) in transverse direction (TD) views, presented as an inverse pole figure (IPF) map, a grain boundaries (GB) map, and a local average misorientation (LAM) map [168].

