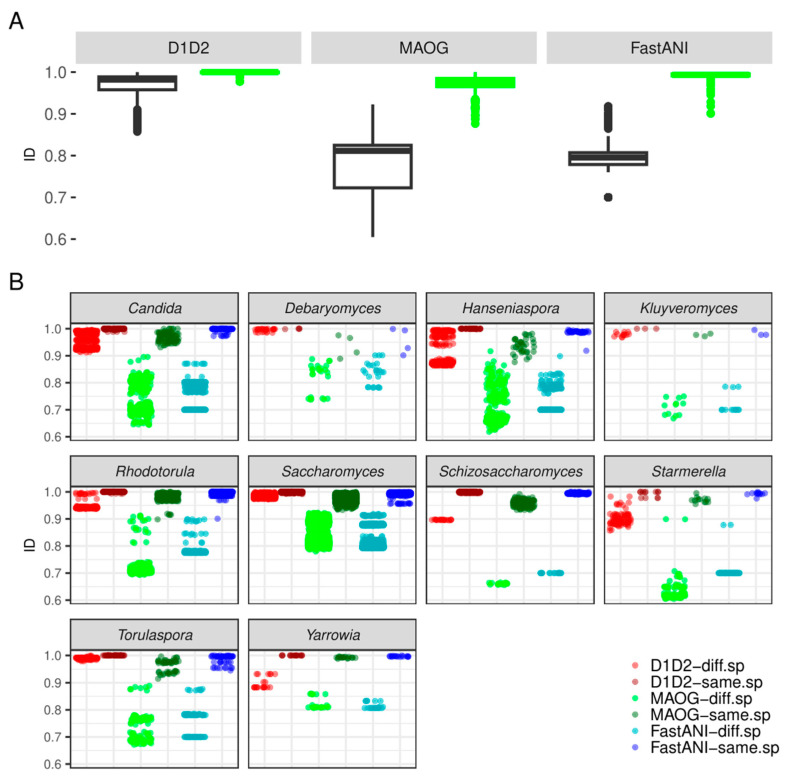
Figure 4.
Comparison of discriminating power between D1/D2, MAOG, and FastANI methods, considering the dataset composed of assemblies analyzed by all three methods (290 genomes). (A) Boxplots of ID (identity) values from pairwise combinations of assemblies belonging to the same (green) or different (black) species for each method. (B) The scatterplot describes the genus-by-genus distribution of identity values from pairwise combinations of assemblies belonging to the same or different species obtained with the three methods (D1/D2 region, MAOG, and FastANI). Points are colored by method and conspecificity. In the legend key, “diff.sp“ means assemblies belonging to different species according to the NCBI Genome database and “same.sp” means the assemblies belonging to the same species according to the NCBI Genome database.

