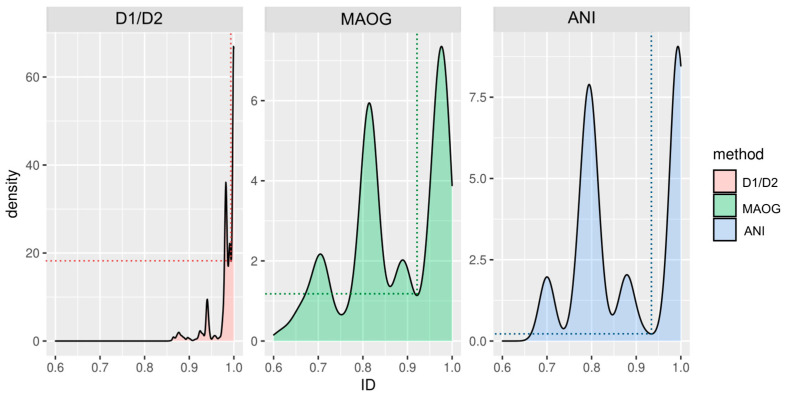
Figure 7.
Density estimation of the pairwise identity values among 290 assemblies was obtained using the D1/D2, MAOG, and FastANI methods. Only identity values between assemblies belonging to the same genus were considered. Curves are a smoothed version of the histogram obtained by the geom_density function of the ggplot2 package in R. The use of these data distributions allowed for the calculation of the local minima between the two peaks on the far right, identified by dotted lines.

