
Fig. 2. Ikaros is expressed in TAC-TECs and Aire+ mTECs.
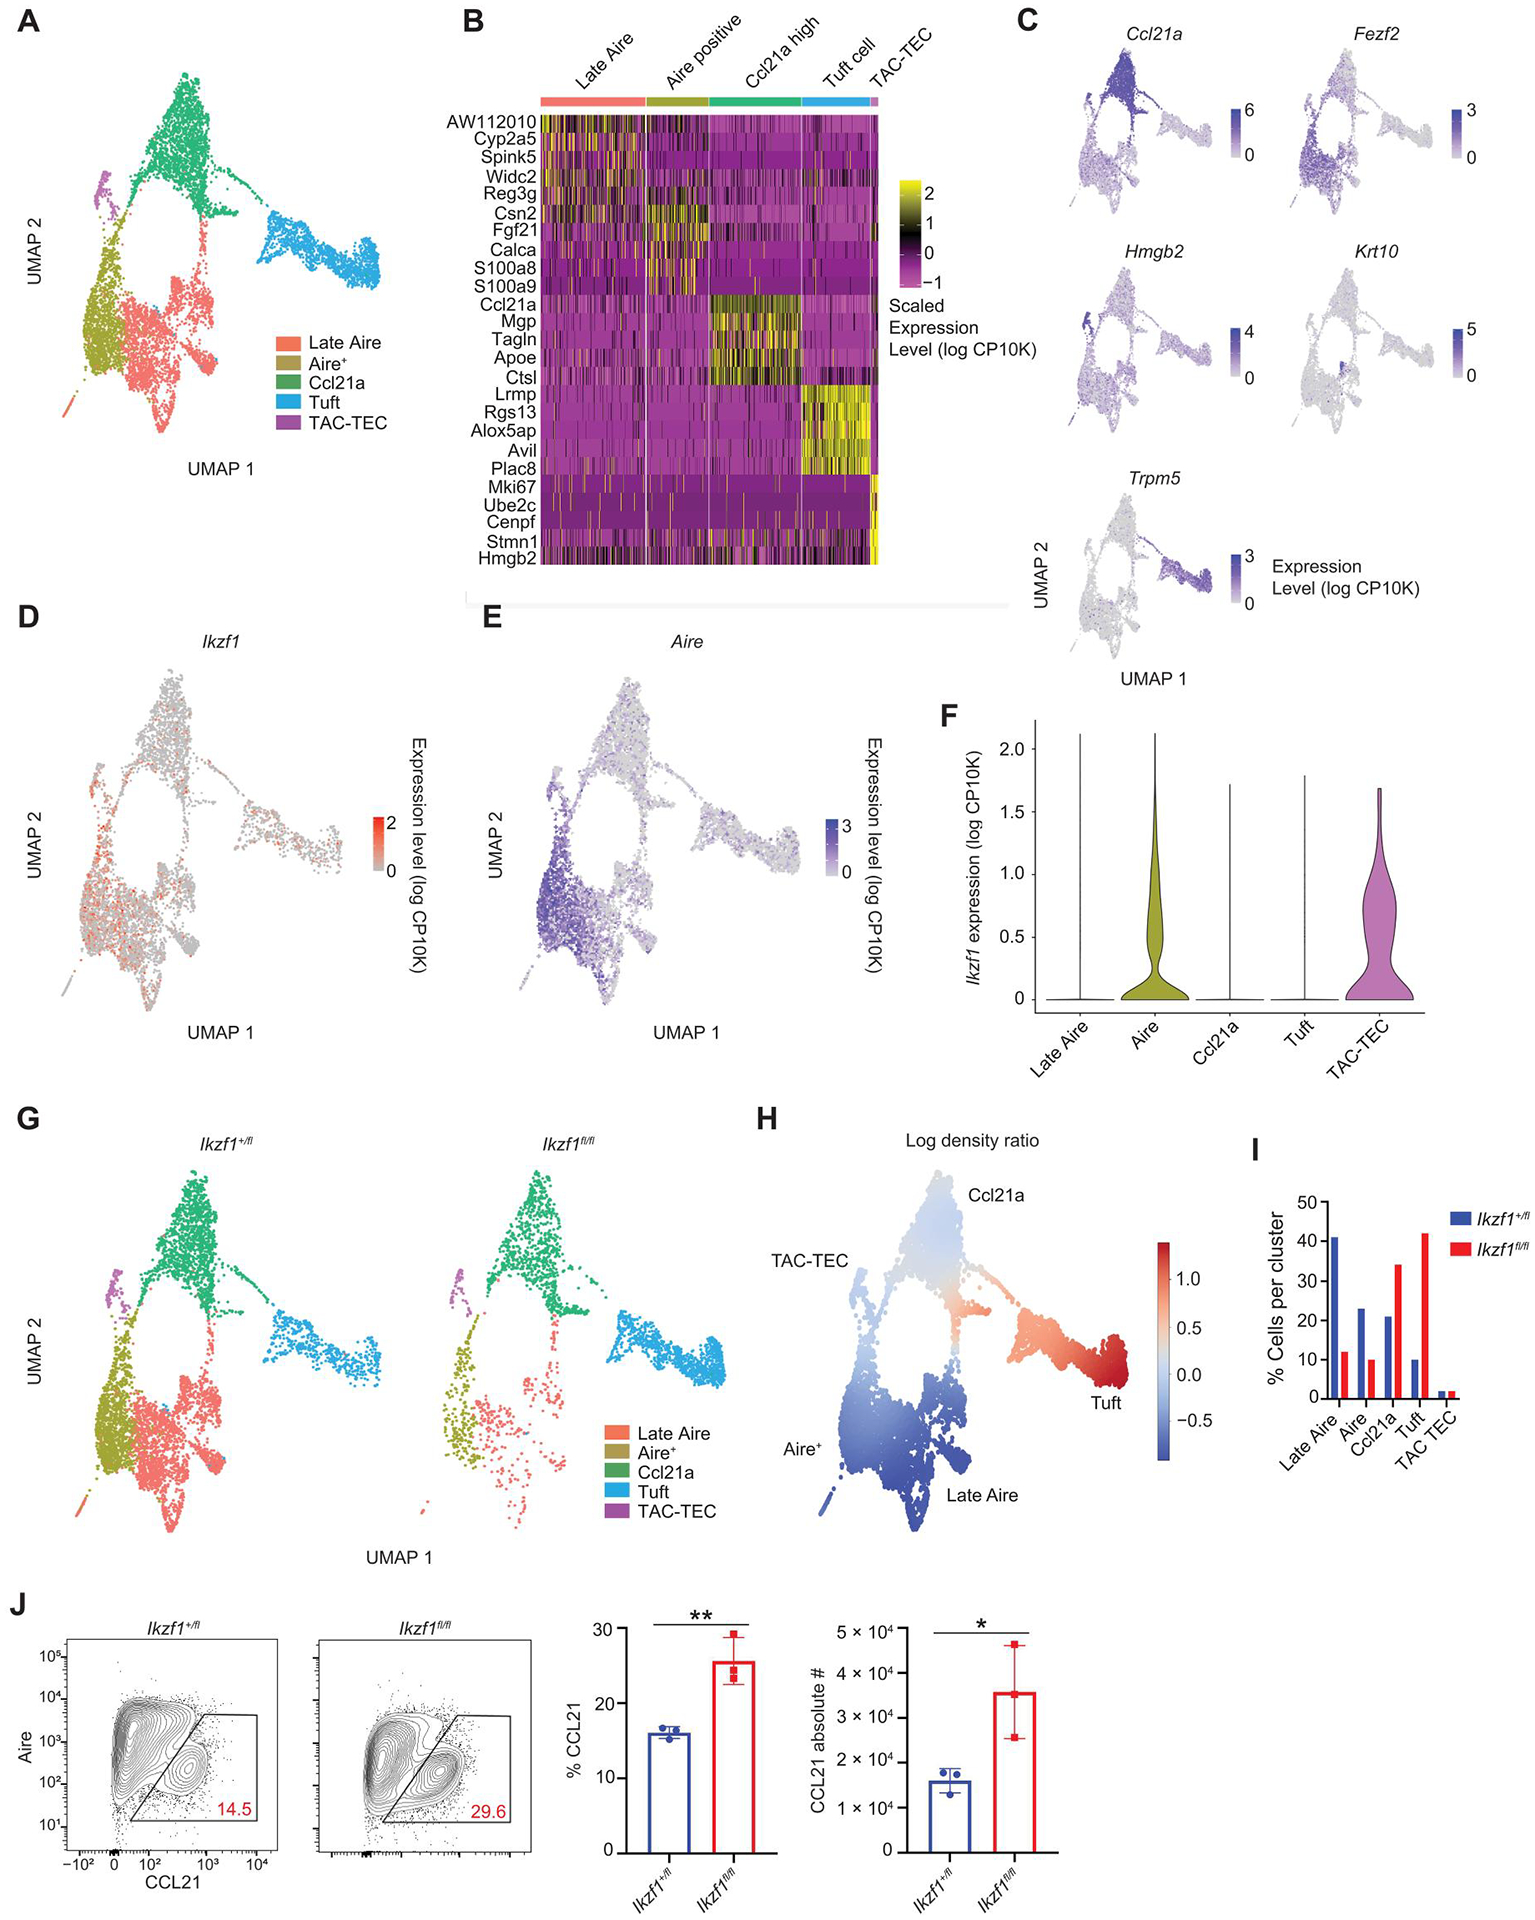
(A) Clustering of scRNA-seq data from sorted CD11c−EPCAM+Ly51− mTECs from Foxn1-Cre/Ikzf1+/fl mice (Ikzf1+/fl) and Foxn1-Cre/Ikzf1fl/fl mice (Ikzf1fl/fl). A total of 5245 mTECs from Ikzf1+/fl mice and 2529 mTECs from Ikzf1fl/fl mice were analyzed. Hematopoietic cells were removed from the UMAP. (B) Heatmap showing top five genes expressed in each mTEC cluster. (C) UMAPs of marker genes for each mTEC subset. (D) UMAP of Ikzf1 expression in Ikzf1+/fl mTECs. (E) UMAP of Aire expression in Ikzf1+/fl mTECs. (F) Violin plot showing Ikzf1 expression in Ikzf1+/fl mTECs. (G) UMAPs of cell distributions in Ikzf1+/fl mTECs and Ikzf1fl/fl mTECs. (H) Differential density plot showing distribution of increasing (red) or decreasing (blue) populations in Ikzf1fl/fl mTECs relative to Ikzf1+/ fl mTECs. (I) Bar graph of the percentage of cells in each cluster normalized to the total number cells sequenced. (J) Flow cytometry (left) and percentage and absolute number (right) of CCL21+ mTECs, gated on CD11c−CD45−EPCAM+Ly51− TECs (n = 3 mice per genotype; one representative experiment). (J) In graphs, the bars correspond to the mean, with error bars showing ±SD of values shown, and each data point represents an individual mouse. (J) Statistical significance was determined using Student’s t test. *P < 0.05 and **P < 0.01.