
Fig. 5. Ikaros is required for TSA gene expression.
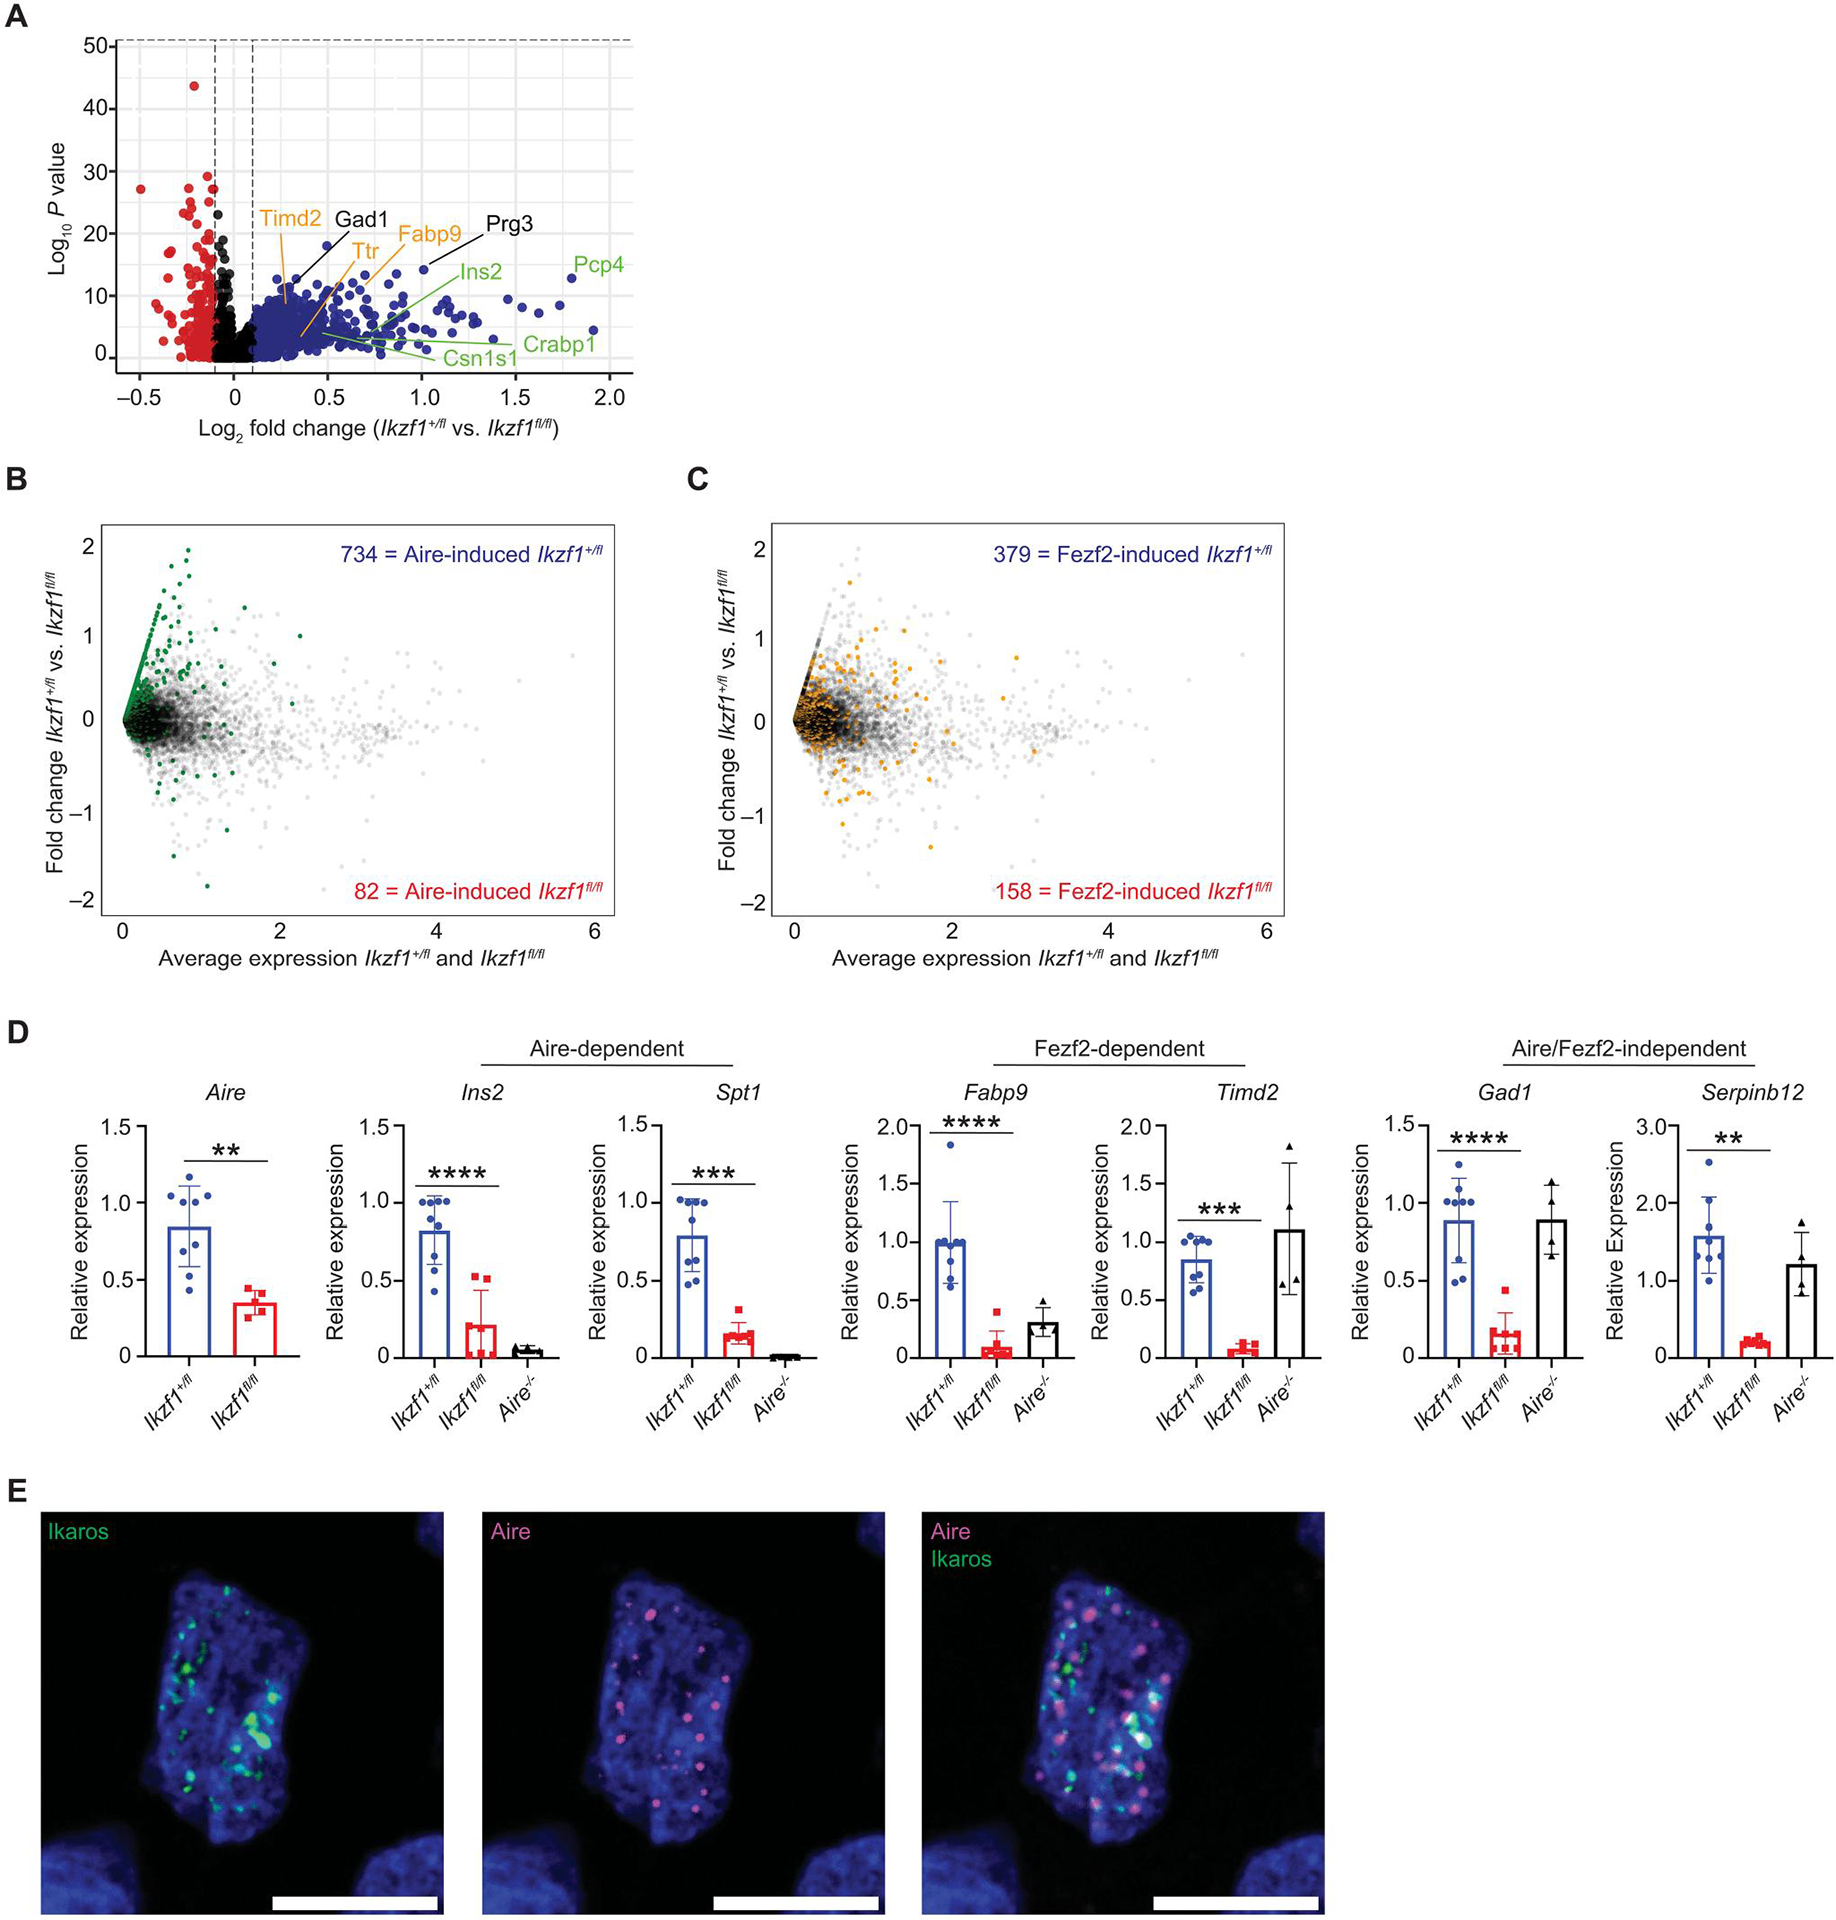
(A) Volcano plot of scRNA-seq from the Aire+ mTEC cluster. A total of 1185 Aire+ mTECs from Ikzf1+/fl mice and 262 Aire+ mTECs from Ikzf1fl/fl mice were analyzed. Plot shows genes expressed in less than 25% of mTECs. Blue dots show genes increased in Ikzf1+/fl mTECs, and red dots are increased Ikzf1fl/fl mTECs. Genes labeled in green are Aire-dependent TSA genes, genes in orange are Fezf2-dependent TSA genes, and genes in black are Aire/Fezf2-independent TSA genes. (B) Overlay of Aire-induced genes in the Aire+ mTEC cluster. Green dots represent genes that are induced by Aire (log2FC > 2, FDR < 0.05). Blue numbers enumerate the number of Aire-induced genes increased in Ikzf1+/fl mTECs, and red numbers equal the number of Aire-induced genes increased in Ikzf1fl/fl mTECs. (C) Overlay of Fezf2-induced genes in the Aire+ mTEC cluster. Yellow dots represent genes that are induced by Fezf2 (log2FC > 1, FDR < 0.05). Blue numbers enumerate the number of Fezf2-induced genes in Ikzf1+/fl mTECs, and red numbers equal the number of Fezf2-induced genes in Ikzf1fl/fl mTECs. (D) qPCR of sorted CD45−Ly51−EPCAM+MHC-IIhigh postnatal day 30 to 40 mTECs for Aire, Aire-dependent TSAs (Ins2 and Spt1), Fezf2-dependent TSAs (Fabp9 and Timd2), and Aire/Fezf2-independent TSAs (Gad1 and Serpinb12). Gene expression levels were normalized to ActB (n = 4 to 8 mice). (E) Immunofluorescence of epitope-tagged Aire (magenta) and Ikaros (green) in an individual 293T cell. One representative cell shown of >30 cells analyzed. Scale bars, 10 μm. (D) In graphs, the bars show the mean, with error bars showing ±SD of values shown, and each data point represents an individual mouse. (D) Statistical significance for Aire expression was calculated by a Student’s t test **P < 0.01. Statistical significance for Ins2, Spt1, Fabp9, Timd2, Gad1, and Serpinb12 expression was calculated using a one-way ANOVA, and grouped comparisons were corrected using Tukey’s multiple comparison test. **P < 0.01, ***P < 0.001, and ****P < 0.0001.