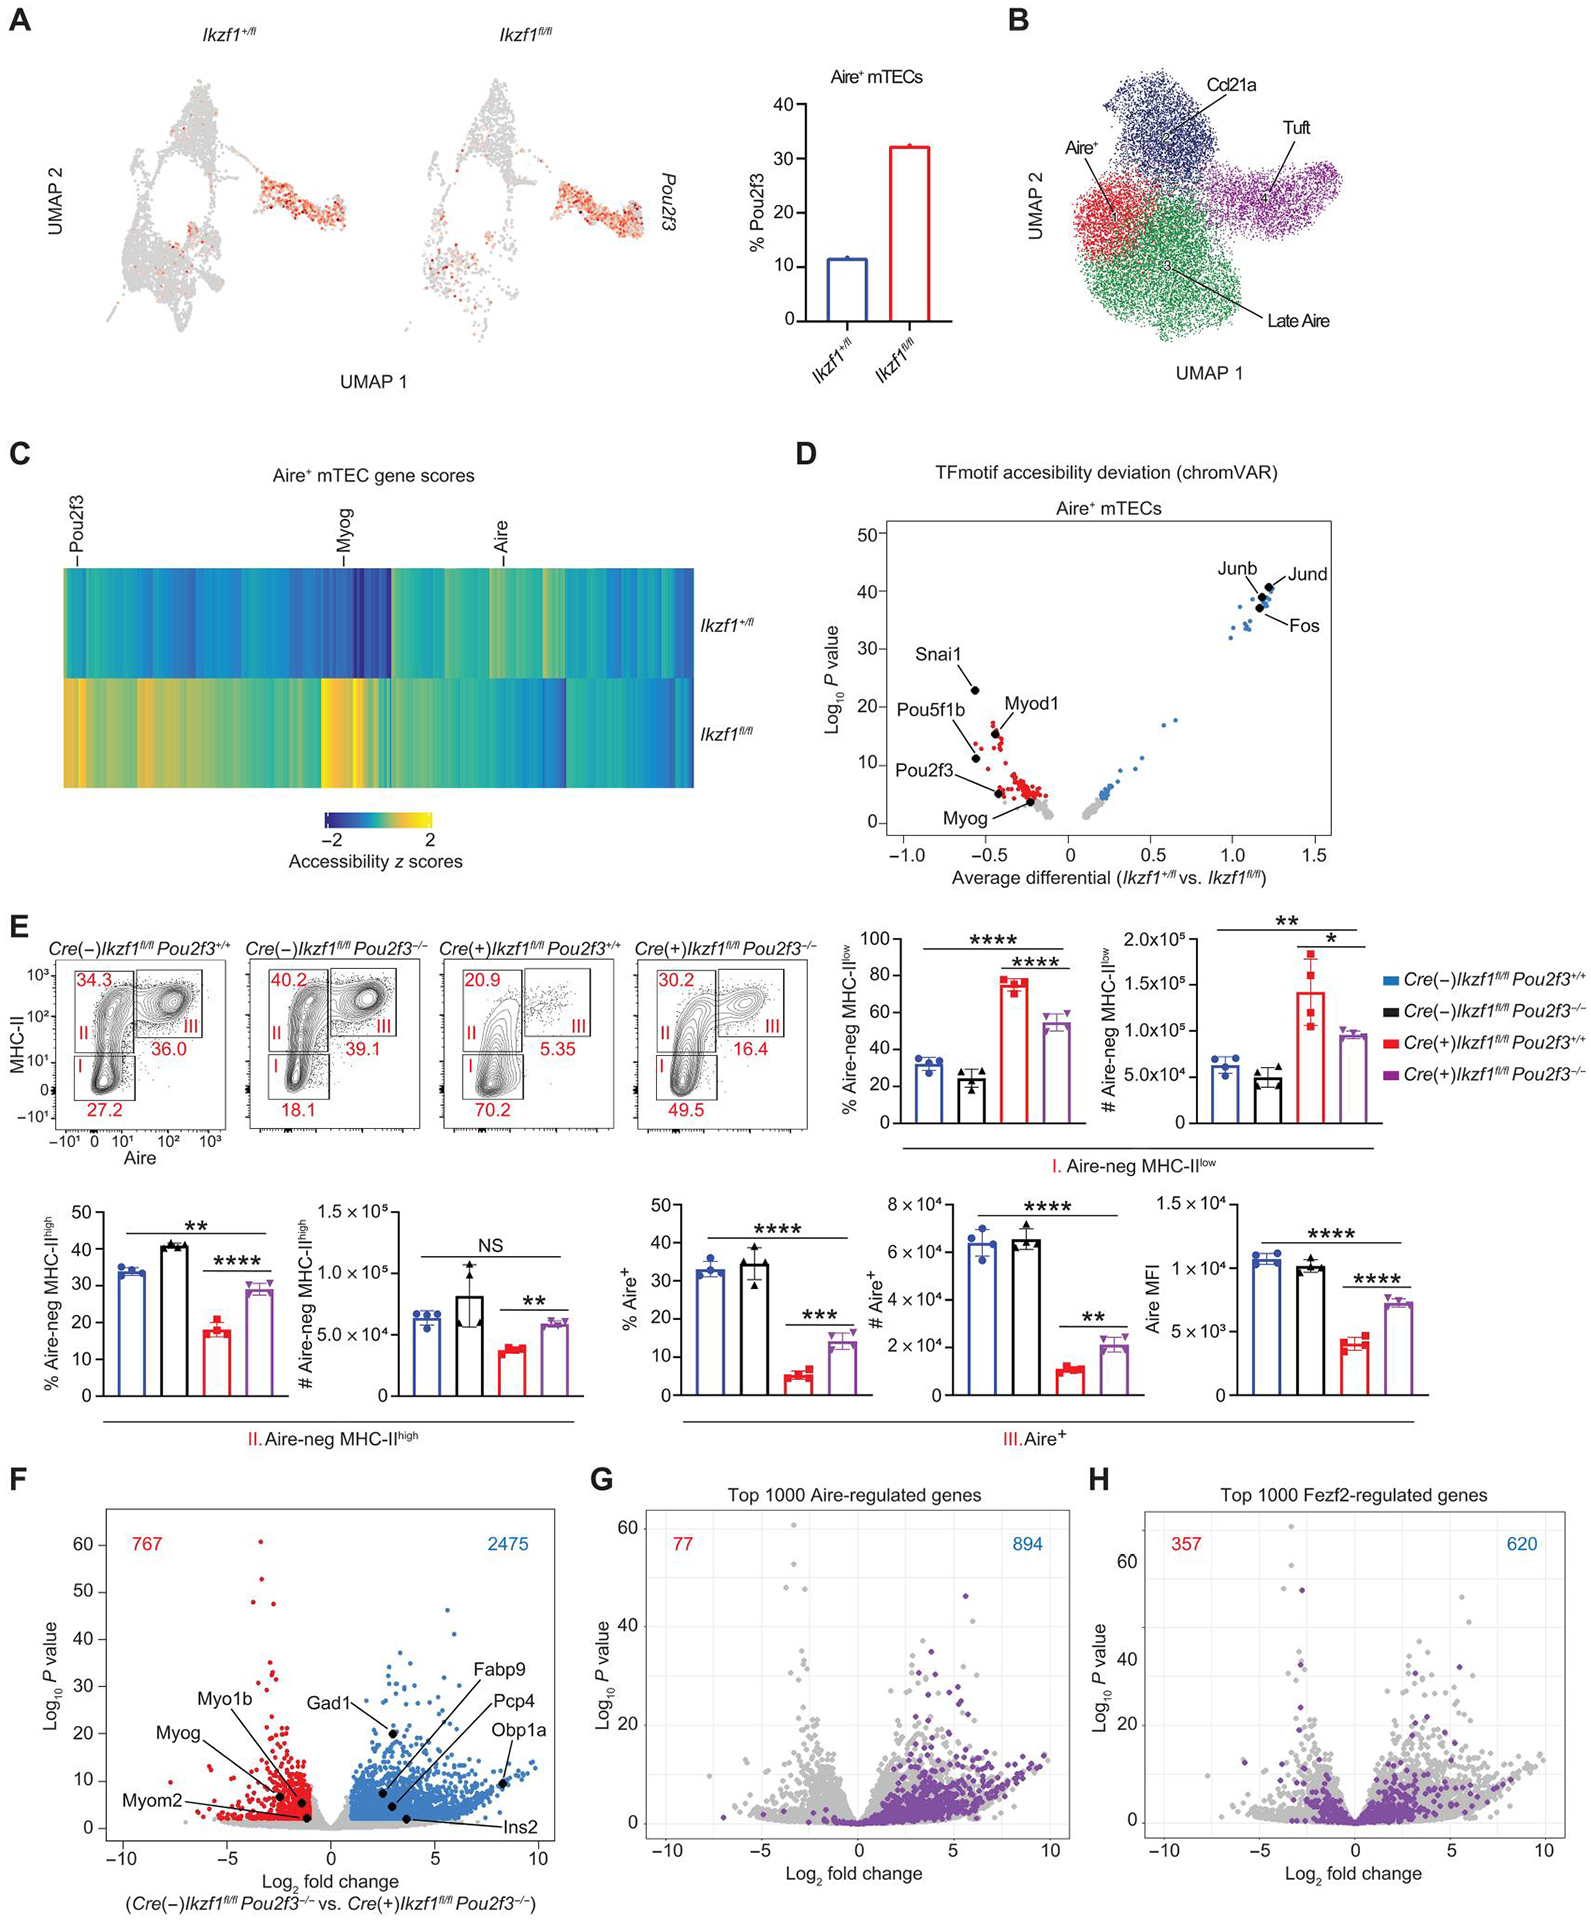
Fig. 6. Deletion of Pou2f3 fails to rescue TSA gene expression.

(A) UMAP of Pou2f3 expression in Aire+ mTECs from scRNA-seq data. A total of 1185 Aire+ mTECs from Ikzf1+/fl mice and 262 Aire+ mTECs from Ikzf1fl/fl mice were analyzed. Red color represents Pou2f3 expression. Bar graph represents the percentage of cells of each genotype expressing Pou2f3 in Aire+ mTECs. (B) scATAC-seq clustering with ArchR. (C) Heatmap of scATAC-seq gene score values (FDR < 0.05) comparing Foxn1-Cre/Ikzf1+/fl (Ikzf1+/fl) versus Foxn1-Cre/Ikzf1fl/fl (Ikzf1fl/fl) Aire+ mTECs. (D) chrom-VAR motif accessibility volcano plot in Aire+ mTECs of the indicated genotype. Blue dots show motifs significantly enriched (FDR < 0.05) in Foxn1-Cre/Ikzf1+/fl (Ikzf1+/fl) Aire+ mTECs. Red dots show motifs significantly enriched in Foxn1-Cre/Ikzf1fl/fl (Ikzf1fl/fl) Aire+ mTECs (FDR < 0.05). (E) Flow cytometry (left) and percentage and absolute number (right) of Aire-negative MHC-IIlow (I), Aire-negative MHC-IIhigh (II), and Aire+ mTECs (III), which were gated on CD11c−-CD45−EPCAM+Ly51− mTECs (n = 4 mice; one representative experiment of two independent experiments). (F) Volcano plot of bulk RNA-seq of sorted CD11c−-EpCAM+CD45−Ly51−MHC-IIhigh mTECs from Foxn1-Cre−/Ikzf1fl/fl/Pou2f3−/− mice and Foxn1-Cre+/Ikzf1fl/fl/Pou2f3−/− mice. Blue numbers indicate the number of genes significantly increased in Foxn1-Cre−/Ikzf1fl/fl/Pou2f3−/− MHC-IIhigh mTECs (FDR < 0.05, log2FC > 1). Red numbers indicate the number of genes significantly increased in Foxn1-Cre+/Ikzf1fl/fl/Pou2f3−/− MHC-IIhigh mTECs (FDR < 0.05, log2FC > 1). The top 1000 Aire-regulated genes are overlaid in (G), and the top 1000 Fezf2-regulated genes are overlaid in (H). In (G), the blue number represents number of Aire-induced genes in Foxn1-Cre−/Ikzf1fl/fl/Pou2f3−/− mice, and the red number represents number of Aire-induced genes in Foxn1-Cre+/Ikzf1fl/fl/Pou2f3−/− mice. In (H), the blue number represents number of Fezf2-induced genes in Foxn1-Cre−/Ikzf1fl/fl/Pou2f3−/− mice, and the red number represents number of Fezf2-induced genes in Foxn1-Cre+/Ikzf1fl/fl/Pou2f3−/− mice. (E) In graphs, the bars correspond to the mean, with error bars showing ±SD of values shown, and each data point represents an individual mouse. (E) Statistical significance was calculated using a one-way ANOVA, and grouped comparisons were corrected using Tukey’s multiple comparison test. *P < 0.05, **P < 0.01, ***P < 0.001, and ****P < 0.0001.
