
Fig. 7. Deletion of Ikaros in mTECs results in defects in negative selection and organ specific autoimmunity.
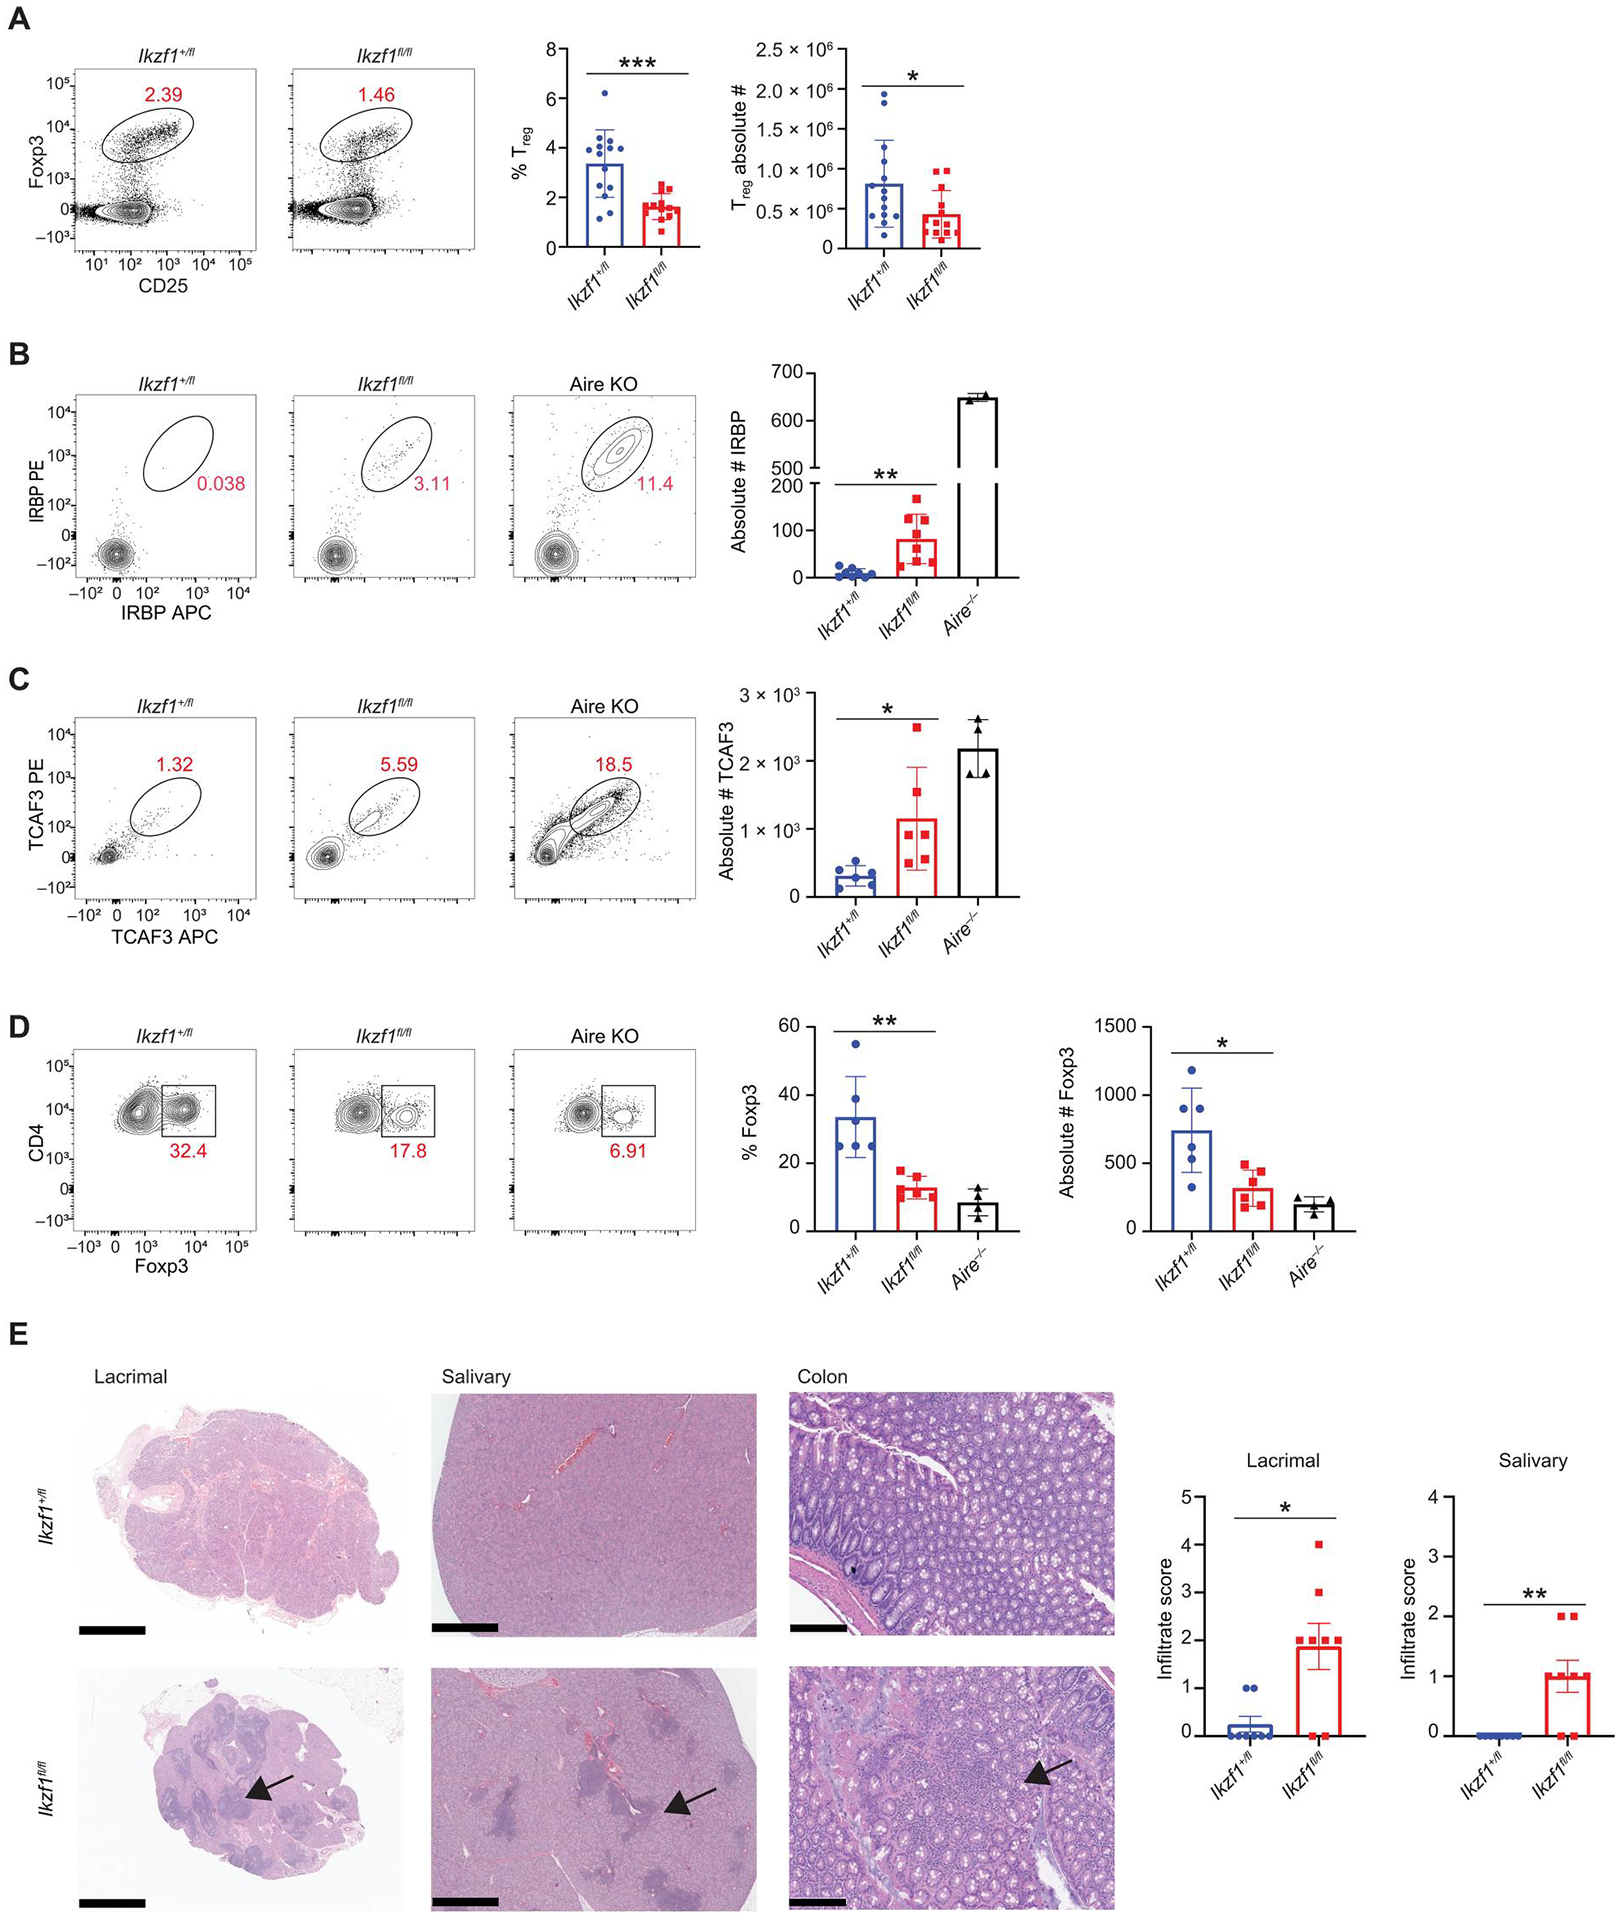
(A) Flow cytometry (left) and percentage and absolute number (right) of thymic CD4+CD73−Foxp3+CD25+ regulatory T cells from Foxn1-Cre/Ikzf1+/fl (Ikzf1+/fl) mice and Foxn1-Cre/Ikzf1fl/fl (Ikzf1fl/fl) mice (n = 13 or 14 mice; five independent experiments). (B) Flow cytometry (left) and absolute number (right) of IRBP+ CD4+ T cells from Ikzf1+/fl, Ikzf1fl/fl, and Aire−/− mice 11 days after immunization with IRBP peptide [n = 8 mice per genotype (Ikzf1+/fl and Ikzf1fl/fl) and n = 2 for Aire−/− mice]. (C) Flow cytometry (left) and absolute number (right) of TCAF3+ CD4+ T cells from male Ikzf1+/fl, Ikzf1fl/fl, and Aire−/− mice 11 days after immunization with TCAF3 peptide [n = 6 mice per genotype (Ikzf1+/fl and Ikzf1fl/fl), n = 4 for Aire−/− mice]. (D) Representative flow plots of CD4+TCAF3+Foxp3+ T cells and percentage of TCAF3+ Tregs [n = 6 mice per genotype (Ikzf1+/fl and Ikzf1fl/fl) and n = 4 for Aire−/− mice]. (E) H&E staining of the lacrimal gland, salivary gland, and colon. Scale bars, 1 mm (lacrimal/salivary) and 200 μm (colon). Bar graphs quantitate lymphocytic infiltrate (n = 8 mice per genotype). (A to E) In graphs, the bar corresponds to the mean, with error bars showing ±SD of values shown, and each data point represents an individual mouse. (A and E) Statistical signify+cance was determined using Student’s t test (A) and Mann-Whitney test (E). *P < 0.05, **P < 0.01, and ***P < 0.001. (B to D) Statistical significance was calculated using a one-way ANOVA, and grouped comparisons were corrected using Tukey’s multiple comparison test. *P < 0.05 and **P < 0.01.