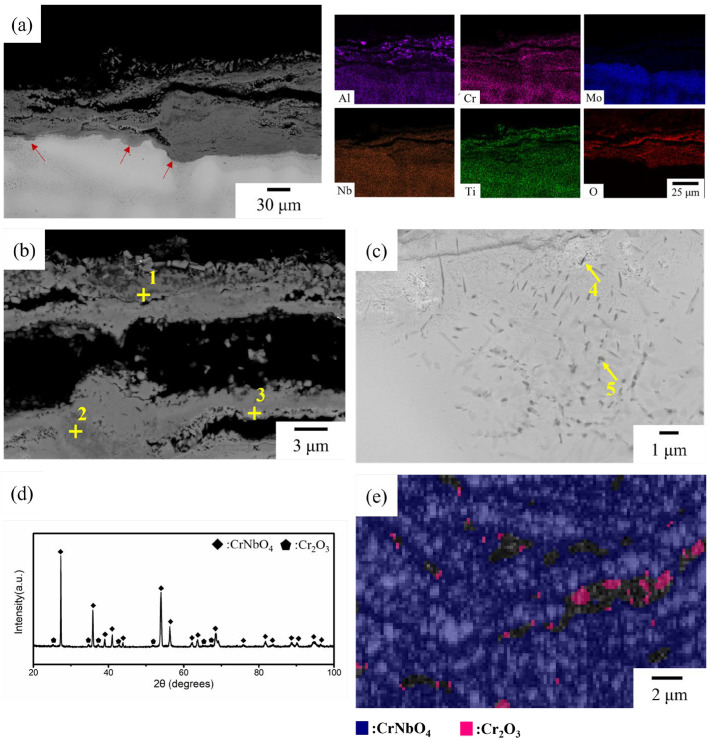
Figure 5.
The oxidized NbTi + AlCrMo for 20 h at 1000 °C: (a) a general view of the oxide layer with EDS mapping, the magnified SEM image of (b) the external oxidation region and (c) the internal oxidation region and (d) the XRD pattern of the oxide layer. (e) The EBSD image with the band contrast and phase characterization of the external oxide region. The red arrows in (a) indicates the oxidation of the interdendritic region. The compositions of the indicated regions in (b,c) are listed in Table 4.

