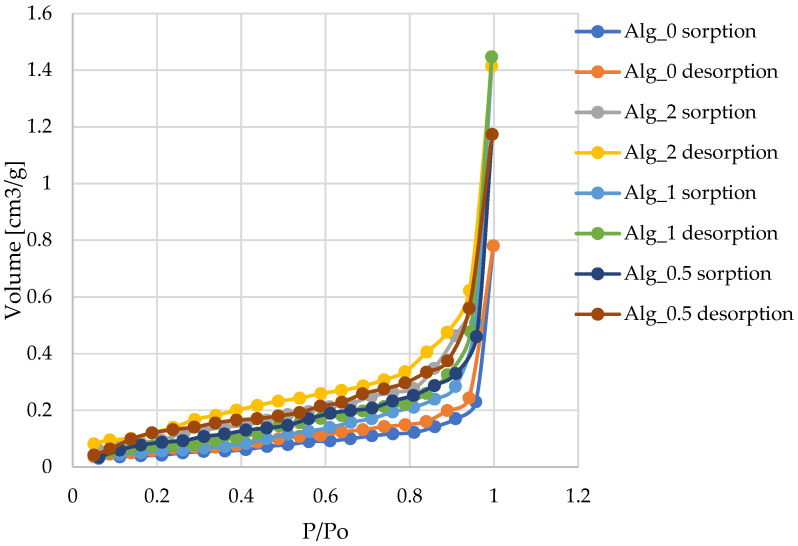
Figure 10.
Isotherms of nitrogen adsorption–desorption at 77 K for the various materials examined in this study are presented as follows: Alg_0; Alg_0.5; Alg_1; Alg_2. The lines in the graphs represent the results of the approximation. The study was conducted through three separate and independent experimental trials. From these trials, a subset of representative results was chosen and presented for comprehensive analysis.

