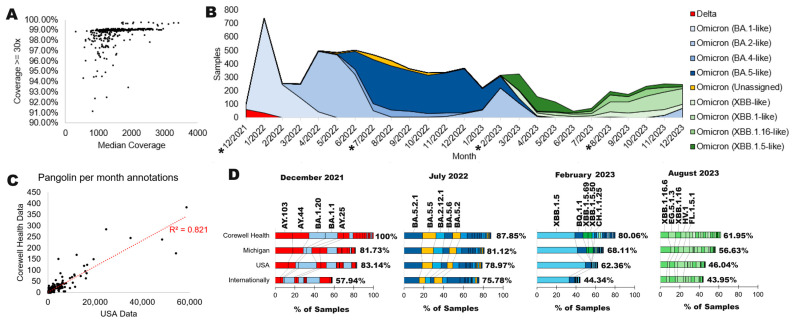
Figure 2.
Corewell Health COVID-19 sequencing data. (A) Sequencing statistics for samples analyzed at Corewell Health using Illumina chemistry. (B) SARS-CoV-2 genotypes per month from December 2021 through December 2023. The “*” indicates months with further processing in panel D. (C) Correlation analysis of the Pangolin annotation each month from the USA (with <100 ambiguous N’s per sequence) relative to Corewell Health. (D) Bar plots for the percent of samples each of four months (starred in panel (D)) for data from Corewell Health, the state of Michigan, the USA, and any NCBI deposited sample (Internationally). Data are shown with the percent of the top 20 Pangolin annotations (top 5 labeled), with the % listed next to the stacked plot representing how many of the total samples are covered by the top 20. Colors correspond to panel (B) annotations for higher-level genotypes.

