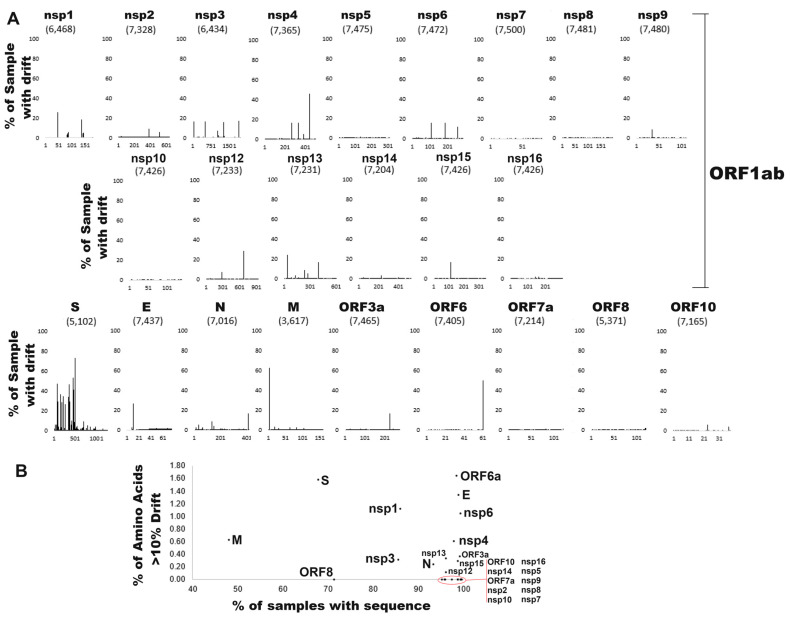
Figure 3.
SARS-CoV-2 protein drift. (A) Per protein amino acid drift relative to the consensus sequence. Shown next to each protein name is the number of sequences without ambiguity. The x-axis shows the amino acid number of each protein, and the y-axis shows the % of samples with drift relative to the consensus amino acid. (B) The per protein sequence coverage relative to the number of amino acids with >10% variation.

