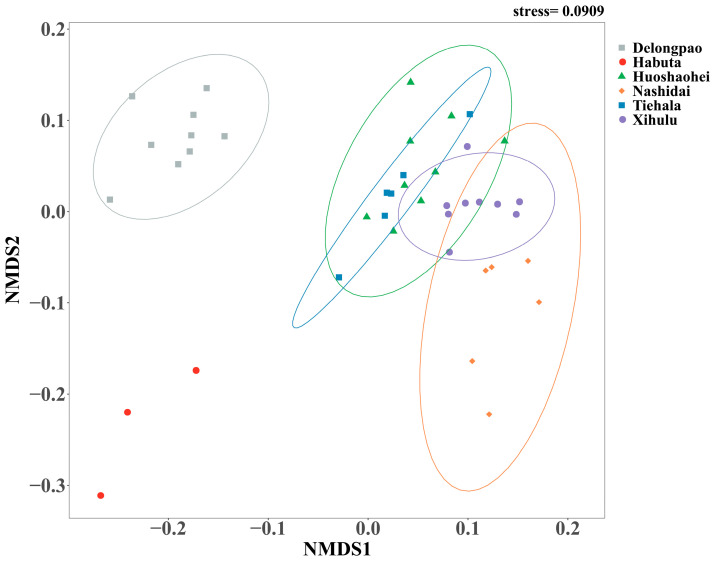
Figure 3.
NMDS analysis of microbial beta diversity based on Bray–Curtis distance metrics. Different colored dots represent the bacterial communities of different lakes. Circles indicate the 95% confidence intervals around the bacterial community estimates. The color of the circles represents different lakes. The stress value reflects the error between the original distances and the low-dimensional spatial distances obtained through NMDS.

