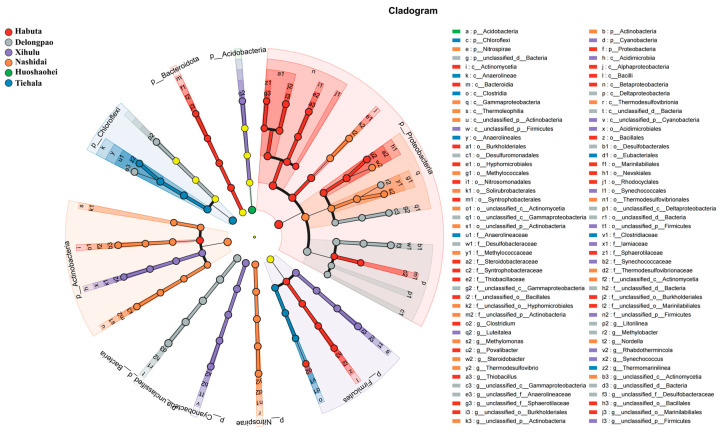
Figure 5.
LEfSe analysis of ASVs among the six lakes (Habuta, Delongpao, Xihulu, Nashidai, Huoshaohei, and Tiehala). The circles represent taxonomic levels from Kingdom to Genus, radiating from inside to outside. Nodes in different colors indicate microbial taxa significantly enriched in the corresponding group and contributing to intergroup differences. Yellow nodes represent taxa that are not significantly different among the groups or have no significant effect on intergroup differences.

